
Global Digital Platform Successful Implementation's In Pan India

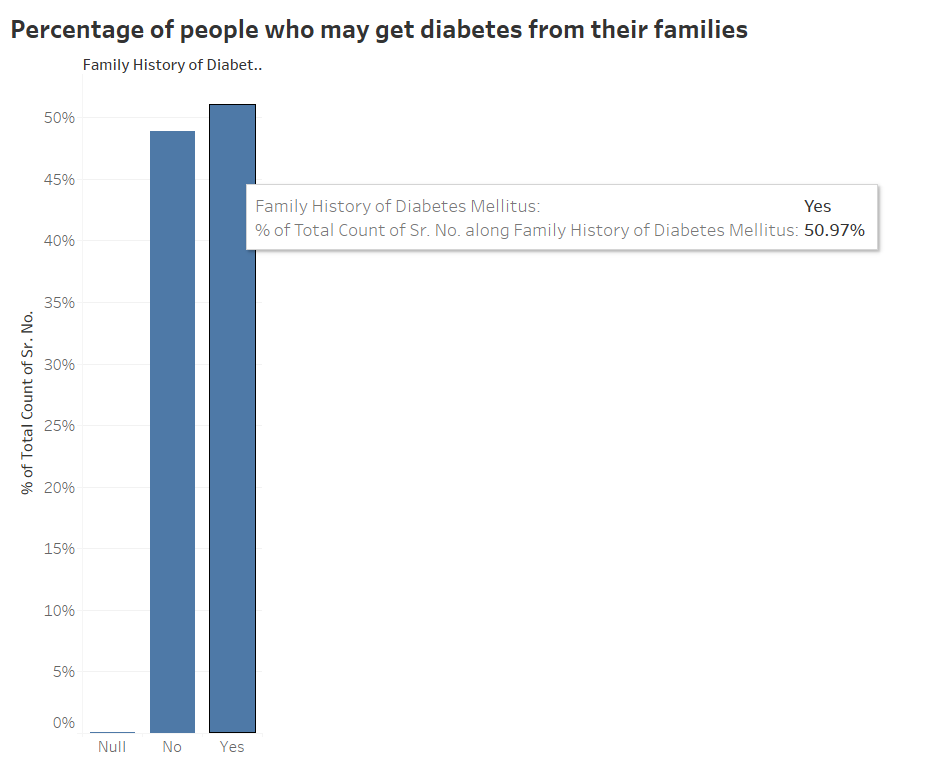
48.91%
This visualization provides insight into the percentage of people without a family history of diabetes, highlighting the significance of lifestyle factors.
50.97%
This chart indicates the proportion of individuals with a genetic predisposition to diabetes, emphasizing the importance of monitoring and early intervention.
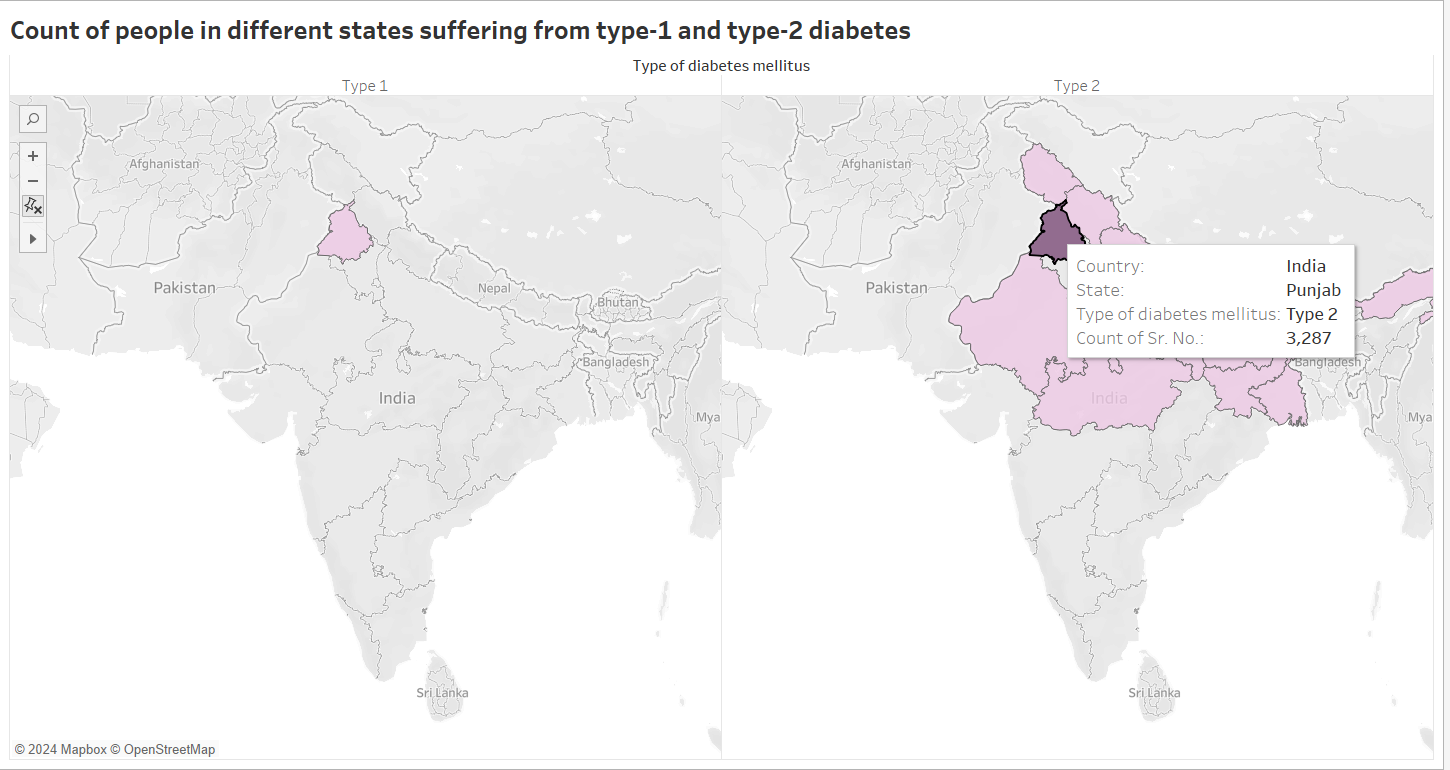
26
The left side of the map highlights the regions affected by type-1 diabetes
3,321
The right side of the map highlights the regions affected by type-2 diabetes
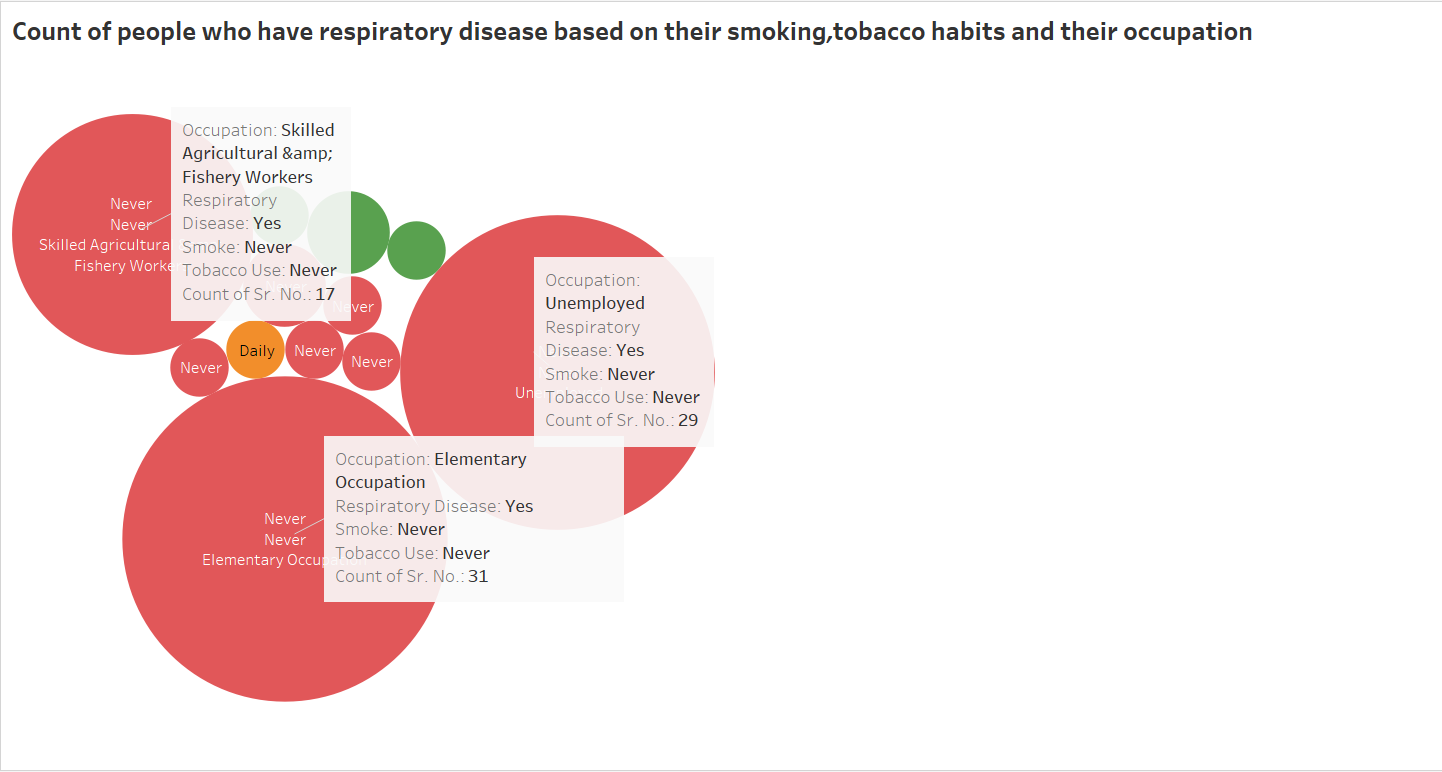
31
Number of patients who had respiratory disease, have never smoked or never used tobacco and worked as elementary occupation.
29
Number of patients who had respiratory disease, have never smoked or never used tobacco and who were unemployed.
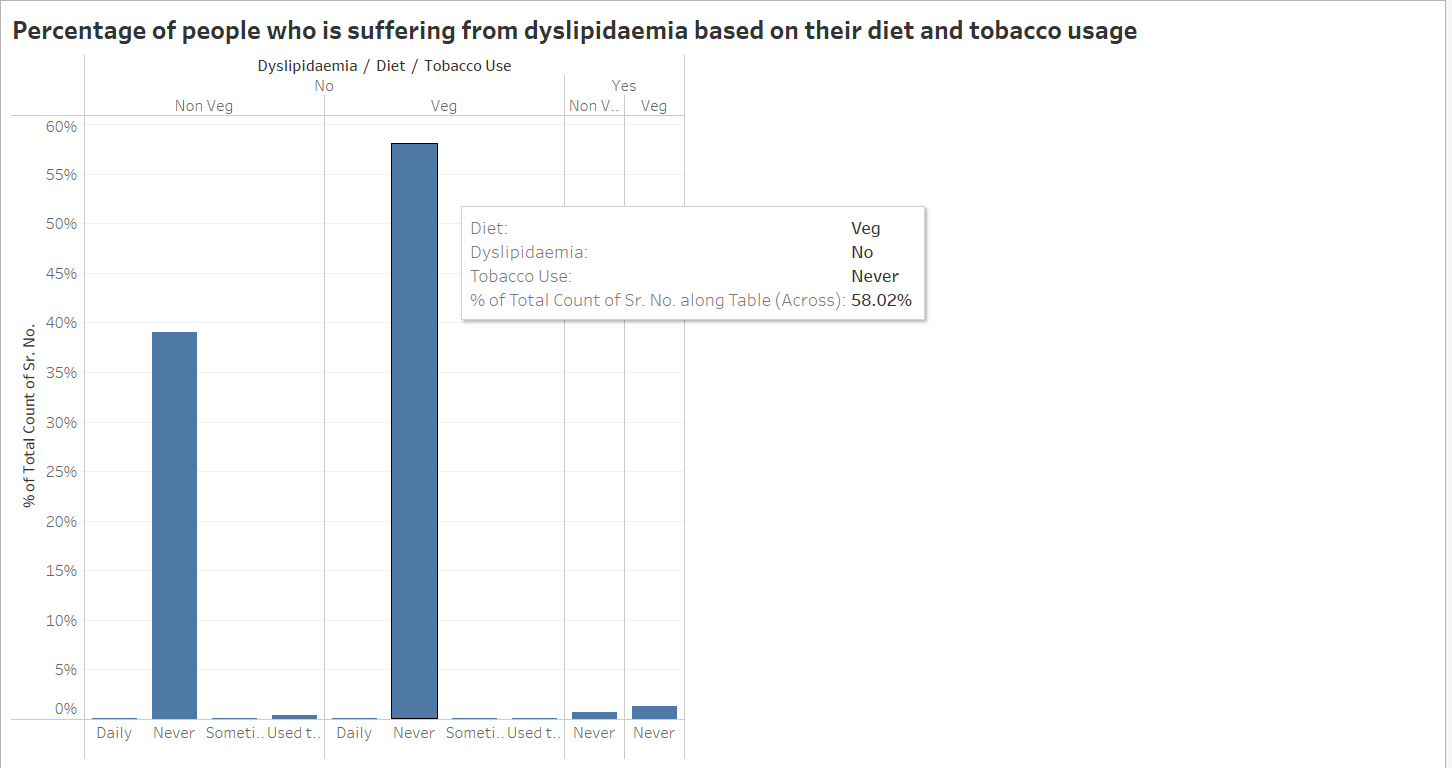
1.35%
1.35% of people have this disease and their diet was veg and but they didn't smoke.
0.72%
Only 0.72% of people have this disease, their diet was nonveg, and they never used tobacco.
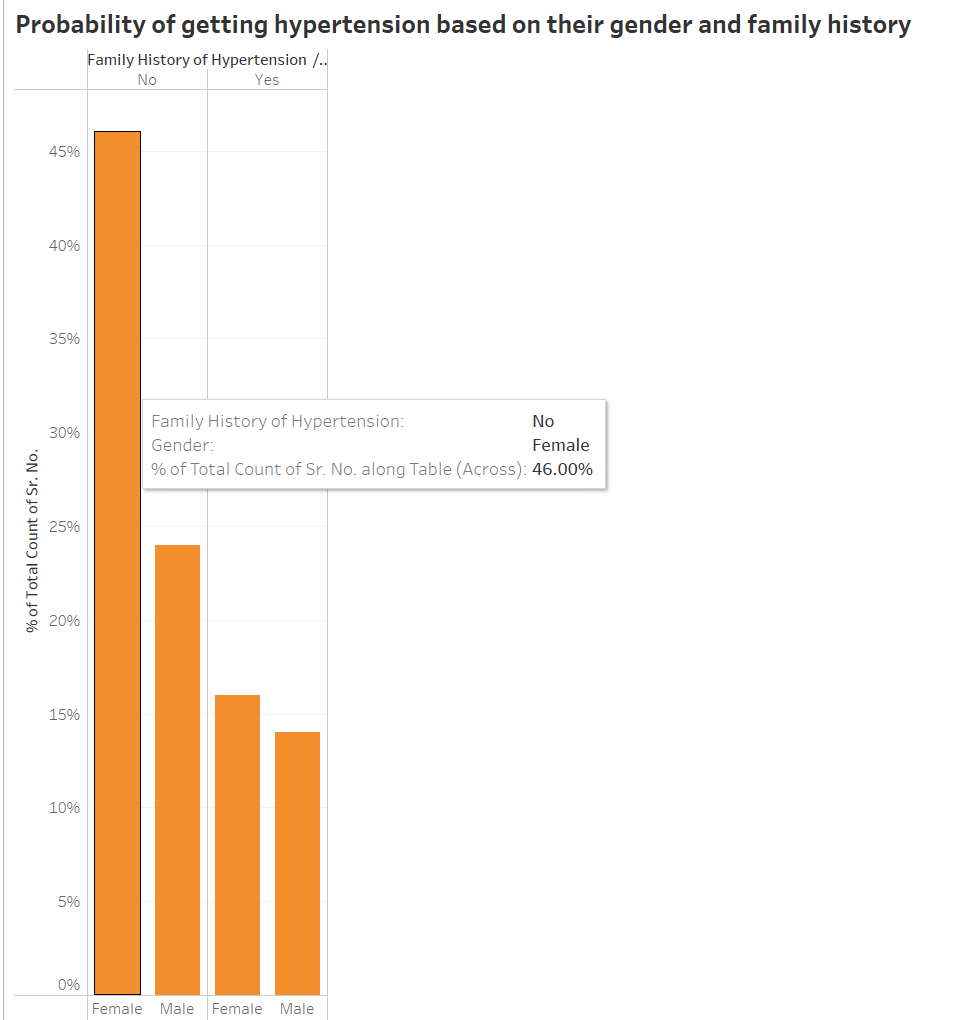
Females-46%
Males-24%
46% of the individuals with no family history of hypertension are females.
Females-16%
Males-14%
16% of the individuals with family history of hypertension are females.
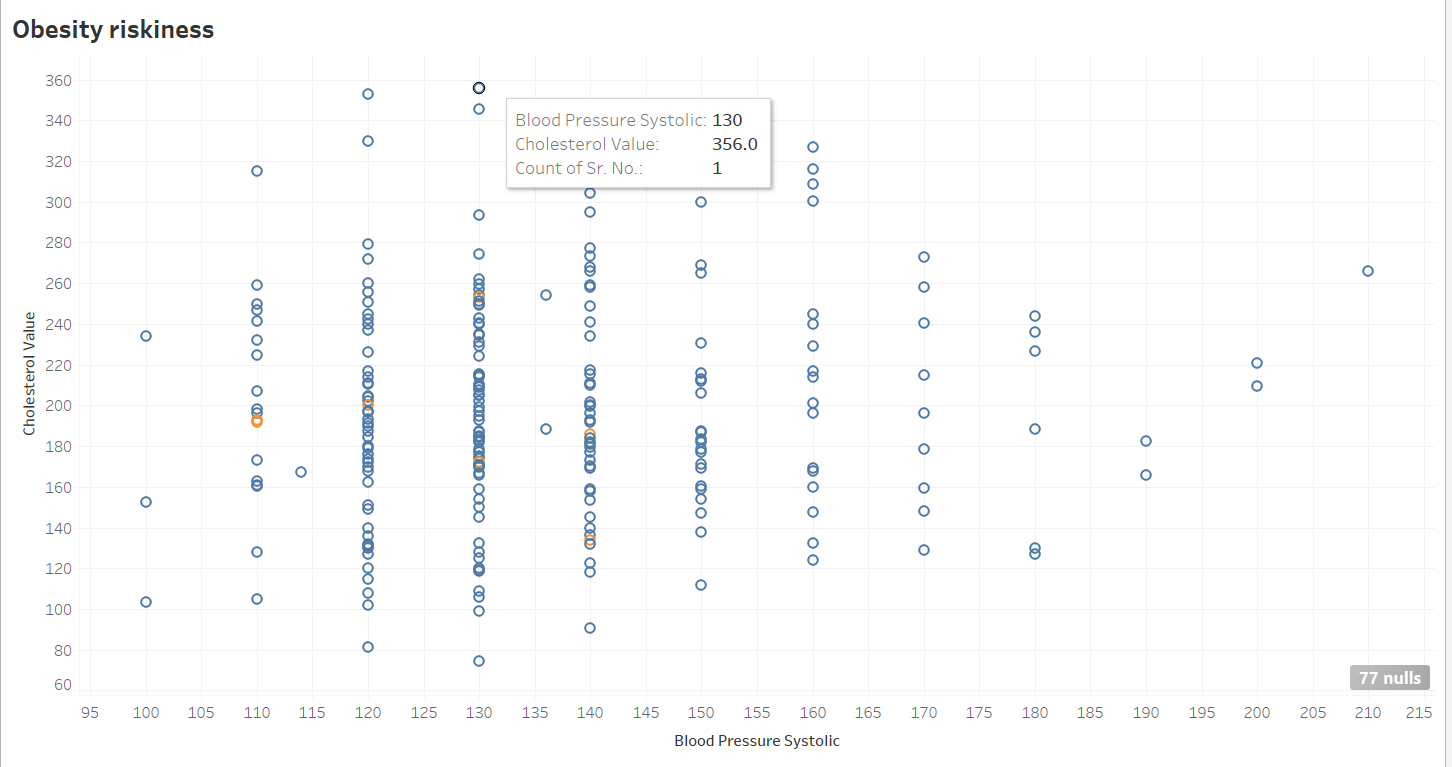
Cholesterol-356
Blood Pressure-130
The individual has a systolic blood pressure of 130 mmHg and a cholesterol value of 356 mg/dL.
Cholesterol-353
Blood Pressure-120
The individual has a systolic blood pressure of 120 mmHg and a cholesterol value of 353 mg/dL.
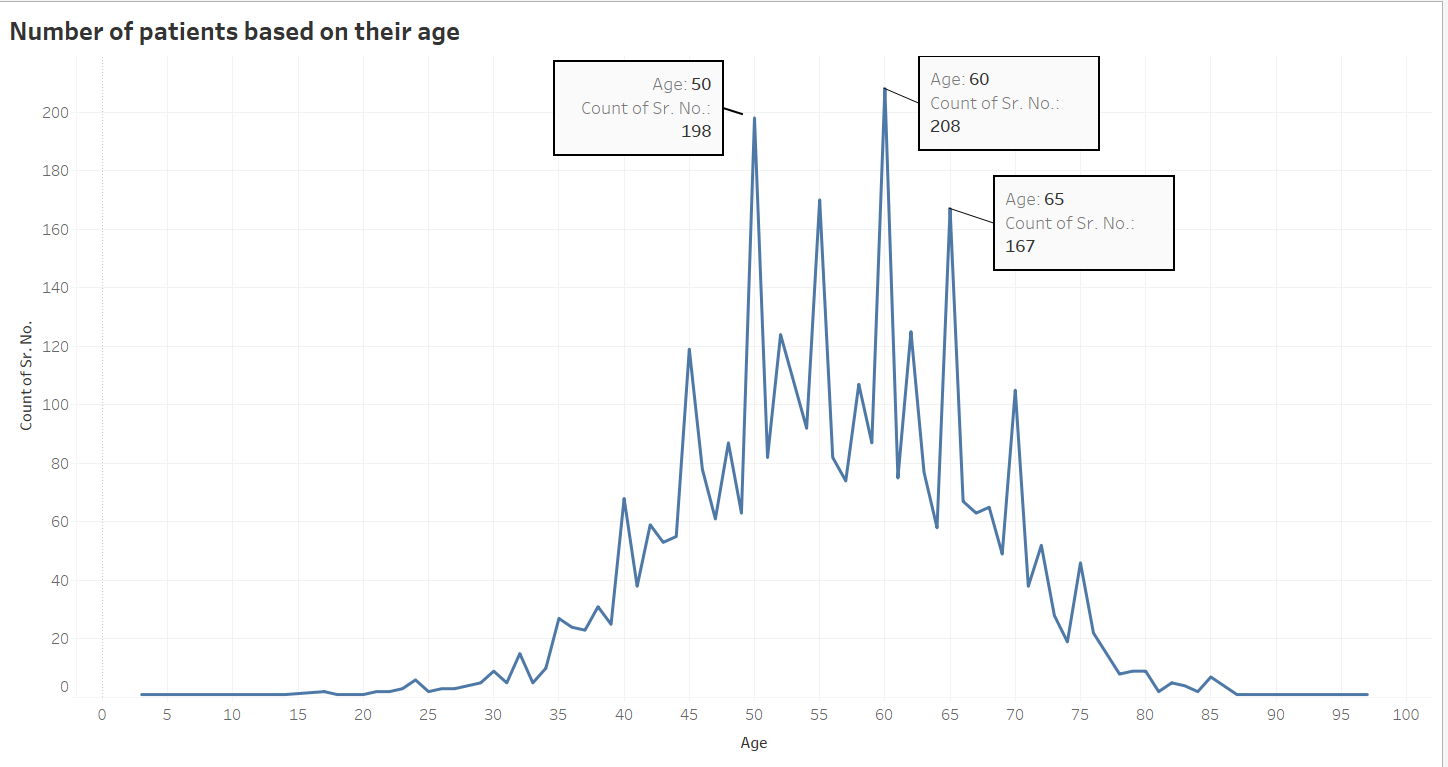
Age-50
Count-198
There are 198 patients with diabetes who are 50 years old.
Age-60
Count-208
There are 208 patients with diabetes who are 60 years old.
Age-65
Count-167
There are 167 patients with diabetes who are 65 years old.
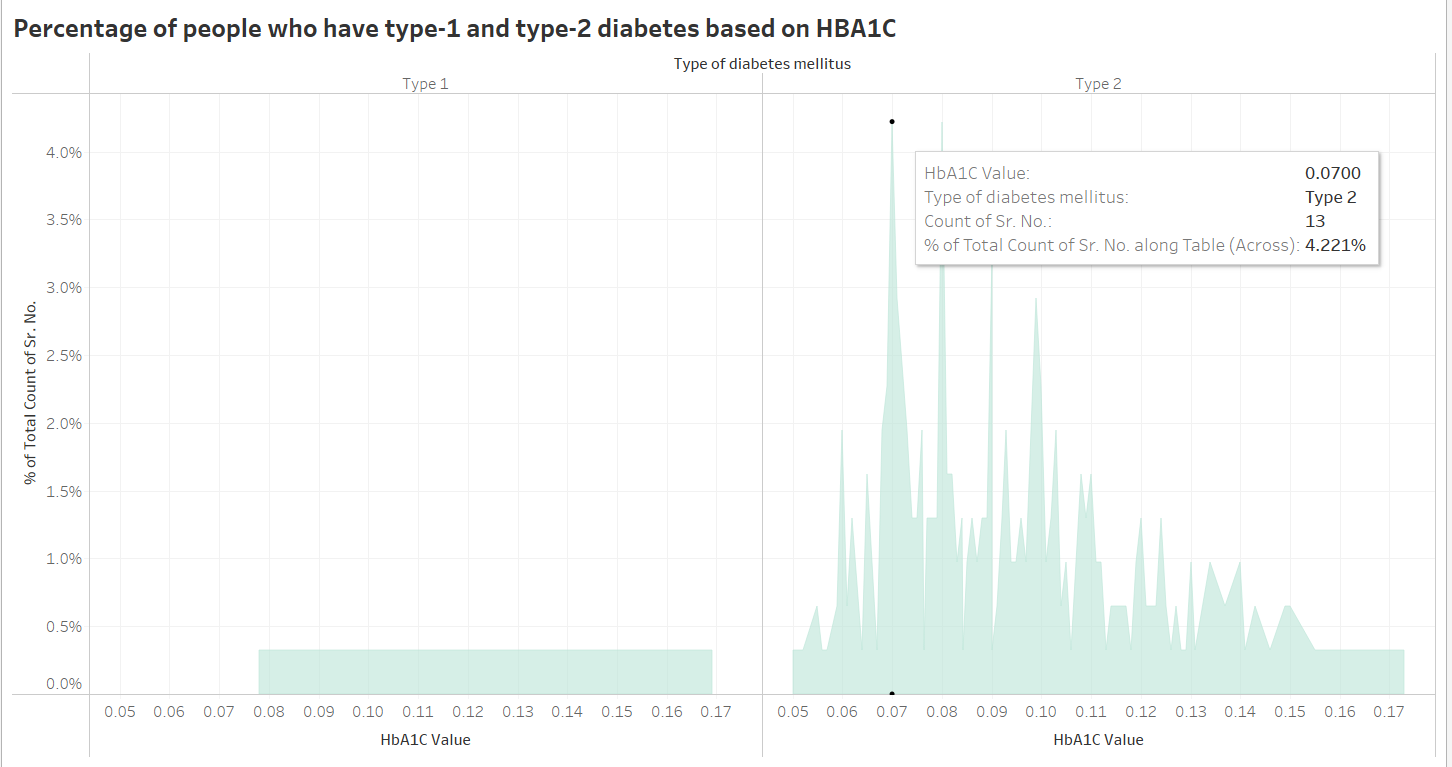
HBA1C Value- 0.0800
Count- 4.221%
The HBA1C value of 0.0800 (8.00%) indicates poor blood sugar control, suggesting the patient may be at higher risk for diabetes-related complications. Regular monitoring and potential adjustments in treatment are recommended.
HBA1C Value- 0.0700
Count- 4.221%
The HBA1C value of 0.0700 (7.00%) shows that blood sugar levels are fairly controlled, but further improvement is possible to reduce the risk of complications associated with Type 2 diabetes. Regular follow-up and lifestyle modifications may be beneficial.
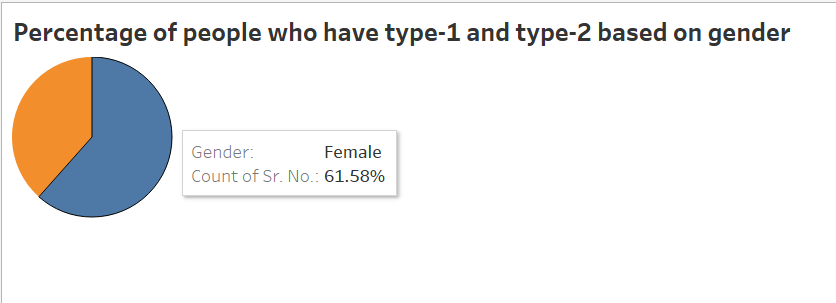
38.42%
With 38.42% of the male population having diabetes, this indicates a significant but lower prevalence compared to females, suggesting the need for targeted prevention and awareness efforts among men.
61.58%
A higher prevalence of diabetes is observed in females, with 61.58% being affected. This highlights the importance of gender-specific strategies in managing and preventing diabetes among women.
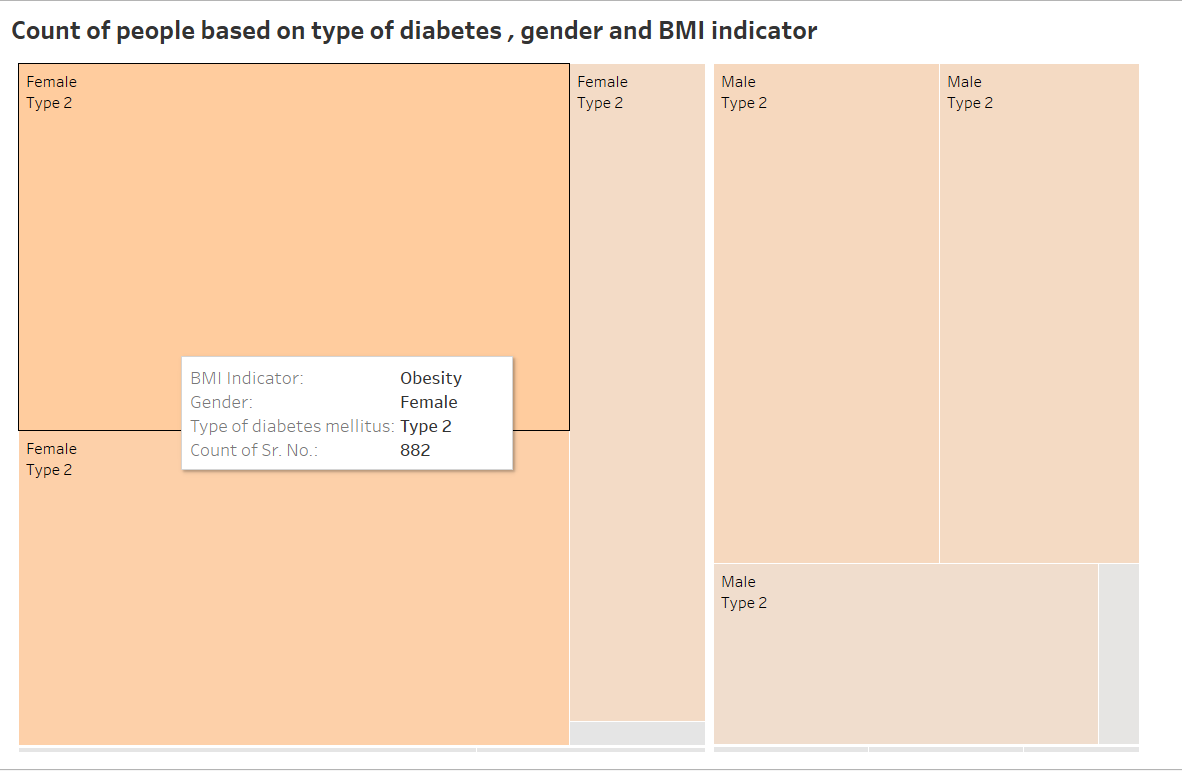
38.42%
With 38.42% of the male population having diabetes, this indicates a significant but lower prevalence compared to females, suggesting the need for targeted prevention and awareness efforts among men.
61.58%
A higher prevalence of diabetes is observed in females, with 61.58% being affected. This highlights the importance of gender-specific strategies in managing and preventing diabetes among women.
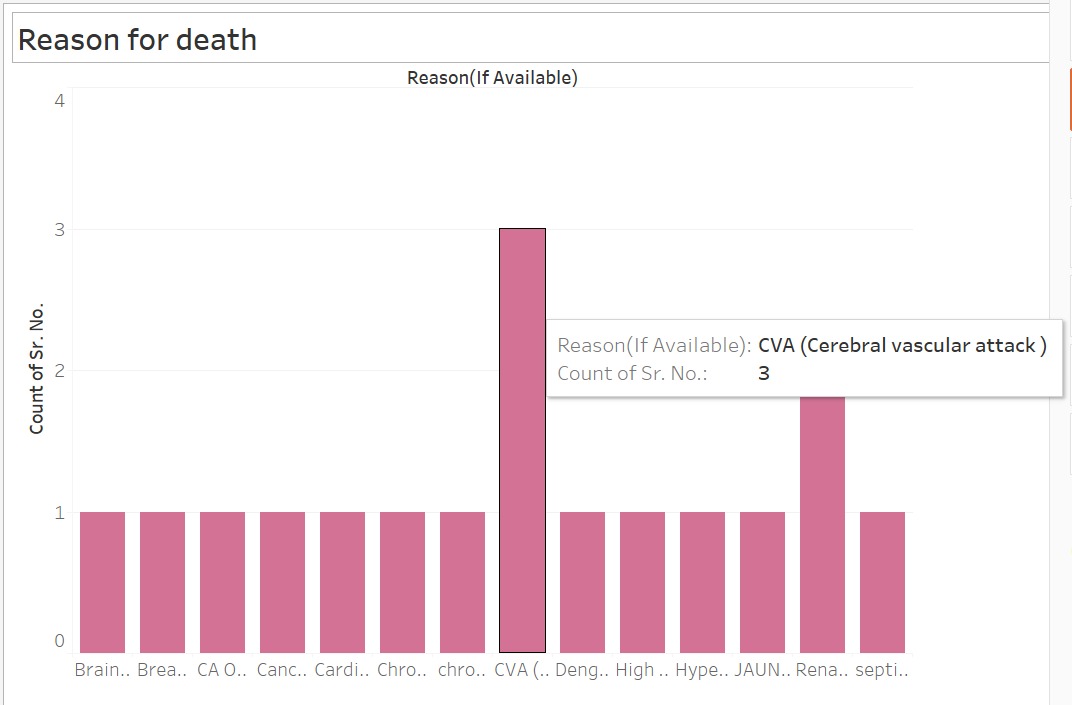
3
The highest recorded reason is "CVA (Cerebral Vascular Attack)" with 3 instances, as shown by the tallest bar in the center.
2
The second highest recorded reason is "Renal related disease" with 2 instances, as shown by the second tall bar.
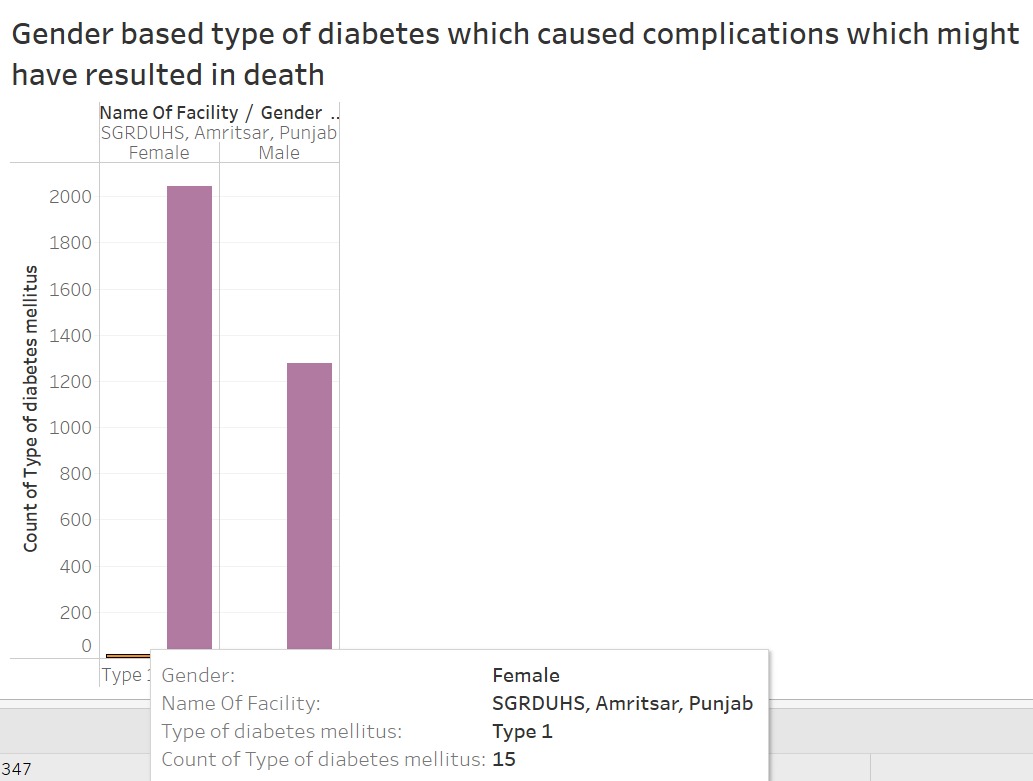
15
The count of type of diabetes mellitus for female is much higher than that of male. The count of type of diabetes mellitus for female is around 15.
10
The count of type of diabetes mellitus for female is much higher than that of male. The count of type of diabetes mellitus for female is around 10.
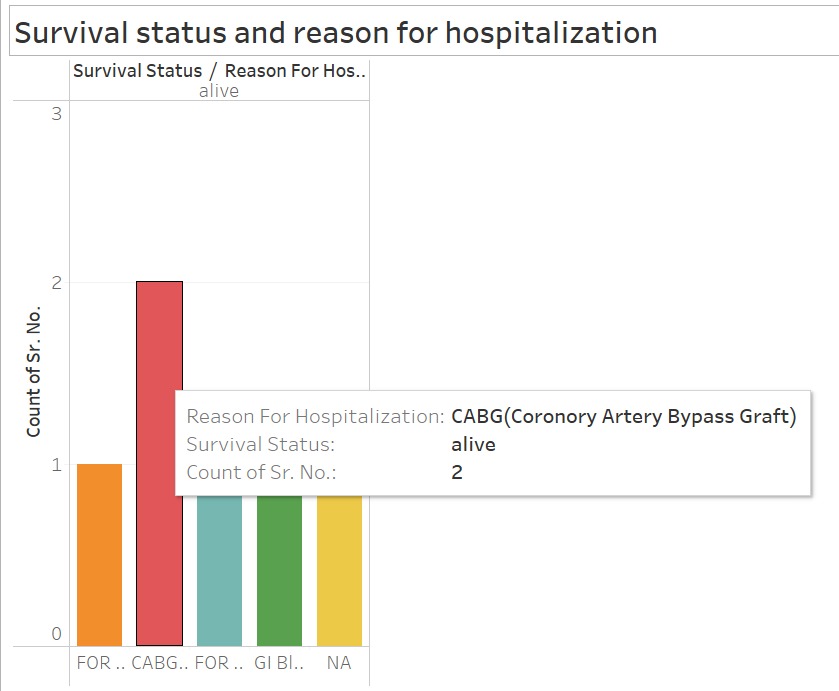
Alive-2
The bar chart displays the count of type 1 diabetes mellitus for patients who died from complications of diabetes, grouped by gender.
Acceptance of Terms
By accessing and using this website, you agree to be bound by the terms and conditions set forth below. If you do not agree to these terms, please do not use the website.
User Accounts and Security:
Each hospital has been provided with unique login credentials. You are responsible for maintaining the confidentiality of your login information and for all activities that occur under your account. You agree to notify us immediately of any unauthorized use of your account or any other breach of security.
Access to Reports and Datasets:
Access to analytical reports and datasets is restricted to authorized users only. Each hospital can only access its own reports and datasets. Attempting to access data or reports of other hospitals is strictly prohibited and may result in termination of access rights and legal action.
Use of Data:
The data and reports provided on this website are intended for internal use by the respective hospitals only. They are not to be shared, reproduced, or distributed without explicit permission from the website administrators.
Data Privacy and Protection:
We are committed to protecting the privacy and security of the patient data contained in the reports and datasets. Any misuse or unauthorized sharing of this data is a violation of these terms and may result in legal consequences.
Feedback and FAQs:
We provide a feedback form for users to ask questions or provide comments. The information submitted through this form may be used to improve the services offered on this website. Please refrain from submitting sensitive or confidential information through the feedback form.
Changes to Terms:
We reserve the right to modify these terms and conditions at any time. Any changes will be posted on this page, and it is your responsibility to review these terms regularly. Continued use of the website after any such changes constitutes your acceptance of the new terms.
Limitation of Liability:
The website and its content are provided on an "as is" basis without warranties of any kind. We do not guarantee the accuracy, completeness, or reliability of the reports and datasets. We are not liable for any damages resulting from the use or inability to use the website or its content.
Contact Information:
If you have any questions about these terms and conditions, please contact us at chairmanoffice@indiancst.in.