
Global Digital Platform Successful Implementation's In Pan India

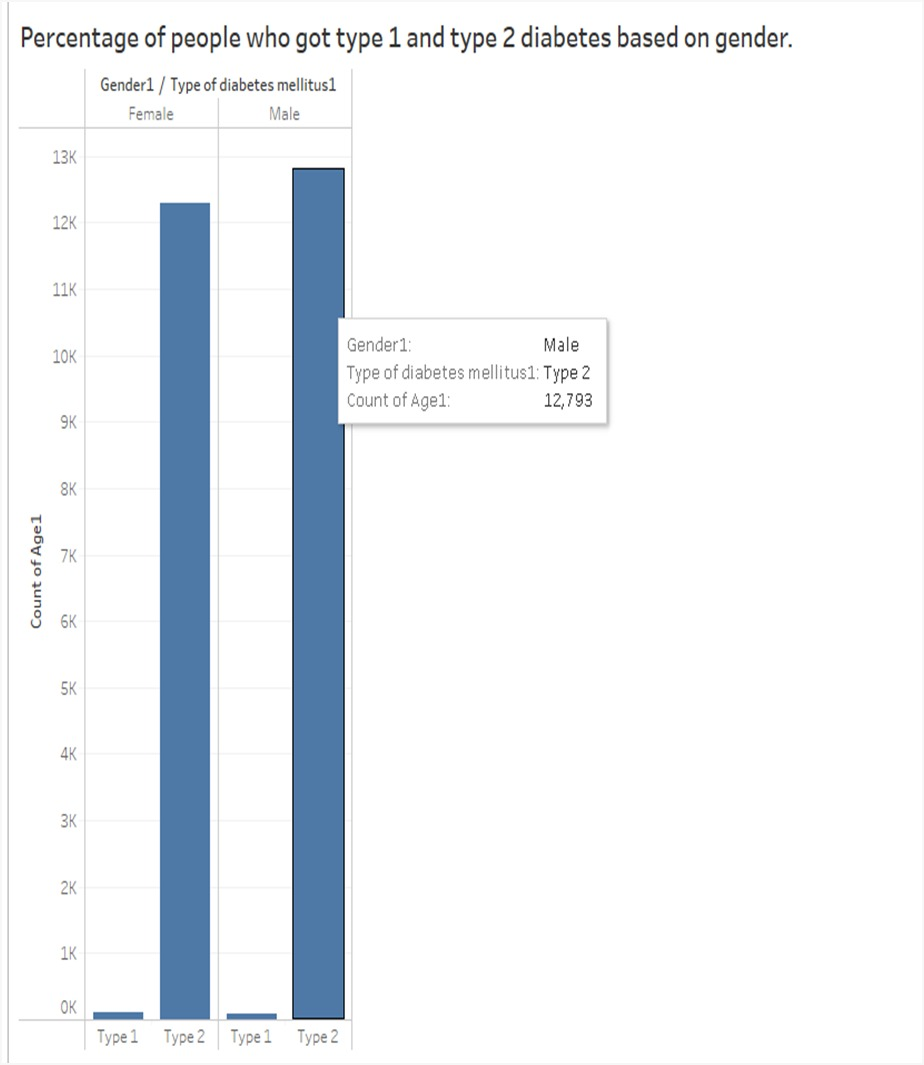
50.58 %
count:12,794
48%
count:12,286
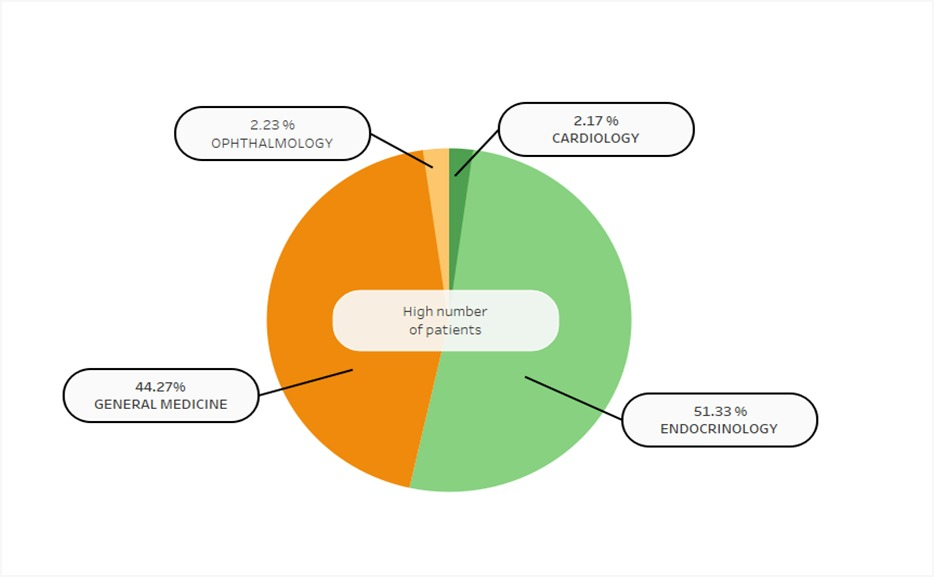
We have around 51.3% of patients being admitted to the department of “ENDOCRINOLOGY” followed by general Medicine , and cardiology department
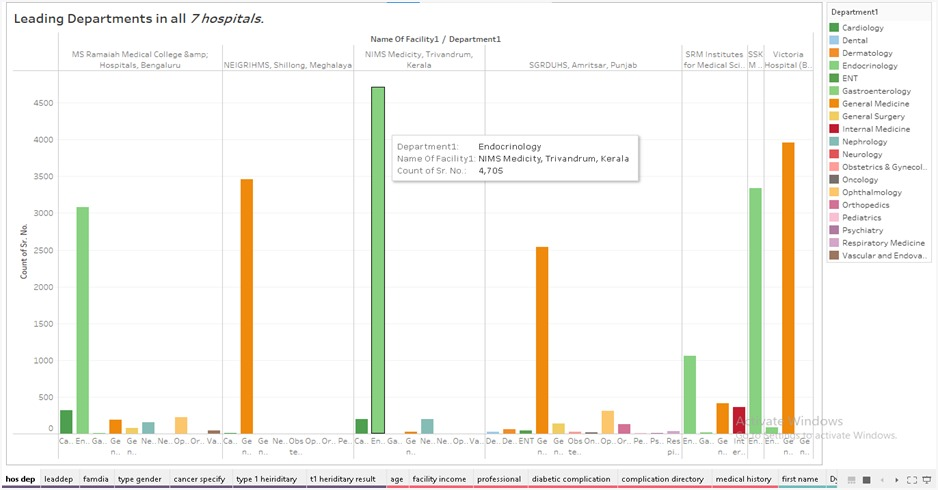
This above graph gives an overall view on high number of patients in every department ,hospital wise most people are under Endocrinology and general medicine departments.
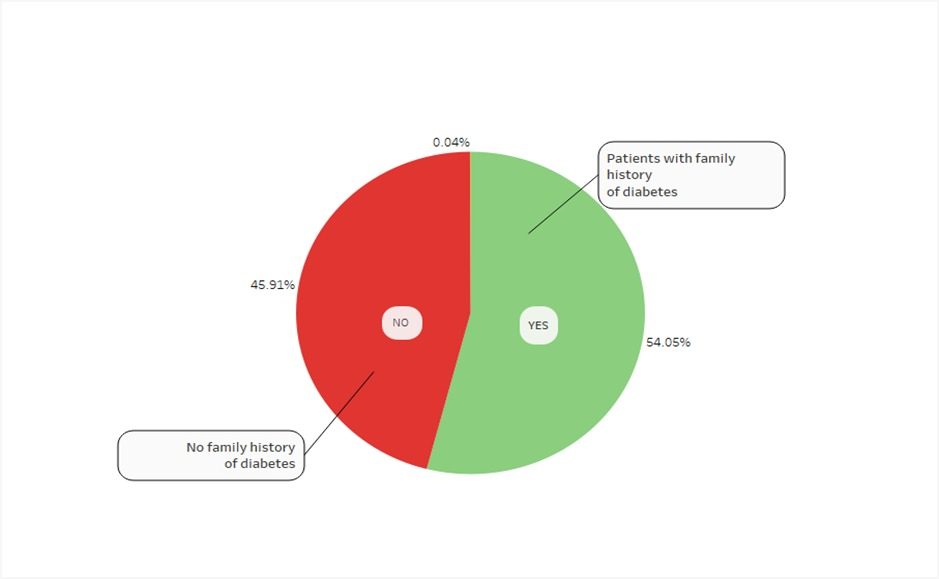
45.91%
This visualization provides insight into the percentage of people without a family history of diabetes
50.97%
This visualization provides insight into the percentage of people with family history of diabetes
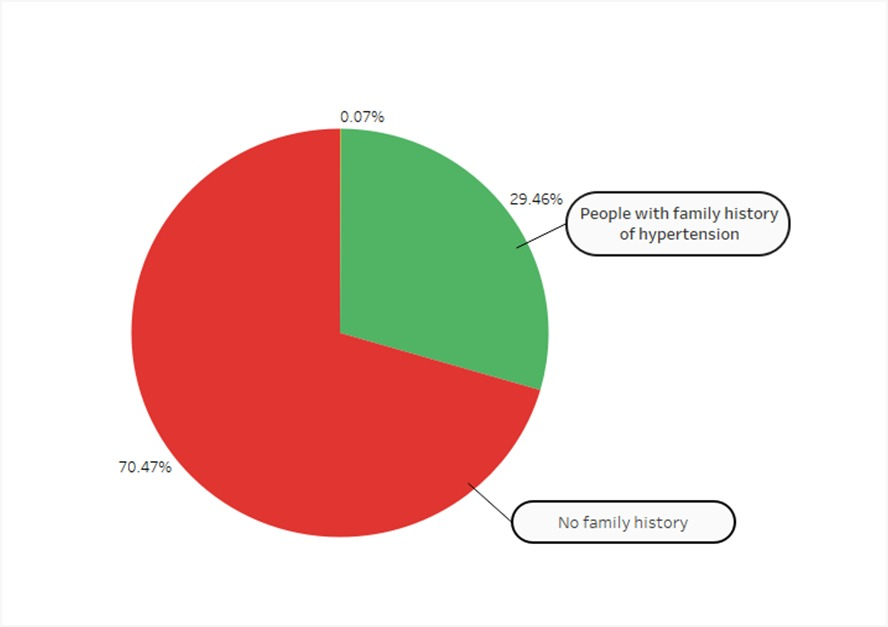
70.47%
This visualization provides insight into the percentage of people without a family history of hypertension
29.46%
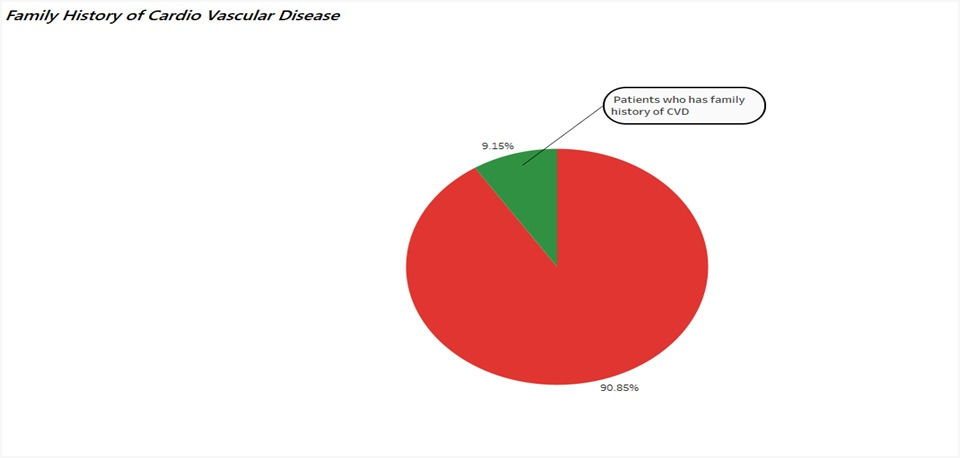
90.85%
This visualization provides insight into the percentage of people without a family history of.
9.15%
This visualization provides insight into the percentage of people with family history of.
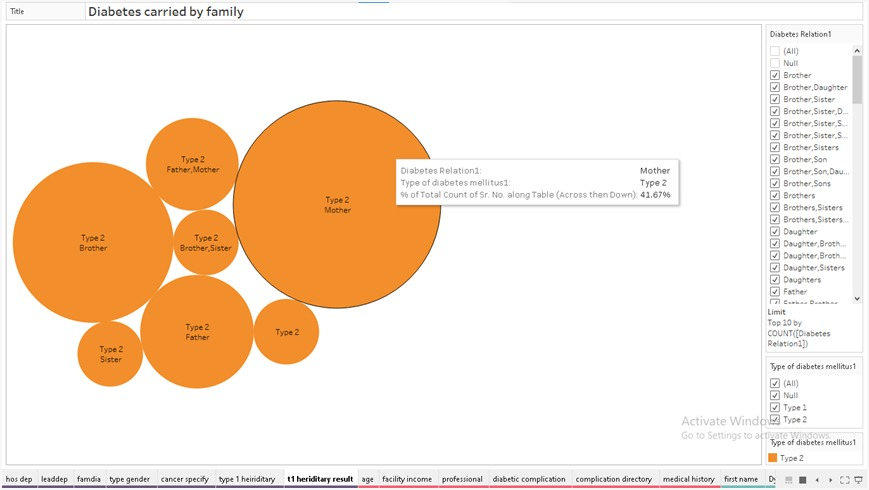
Total numbers of patients who have type 1 diabetes are 213 among 25,293 records of patients, and it is mainly carried from ‘Fathers’. We can visually see in the packed bubble chart that Type 2 diabetes is highly carried from ‘Mothers’.
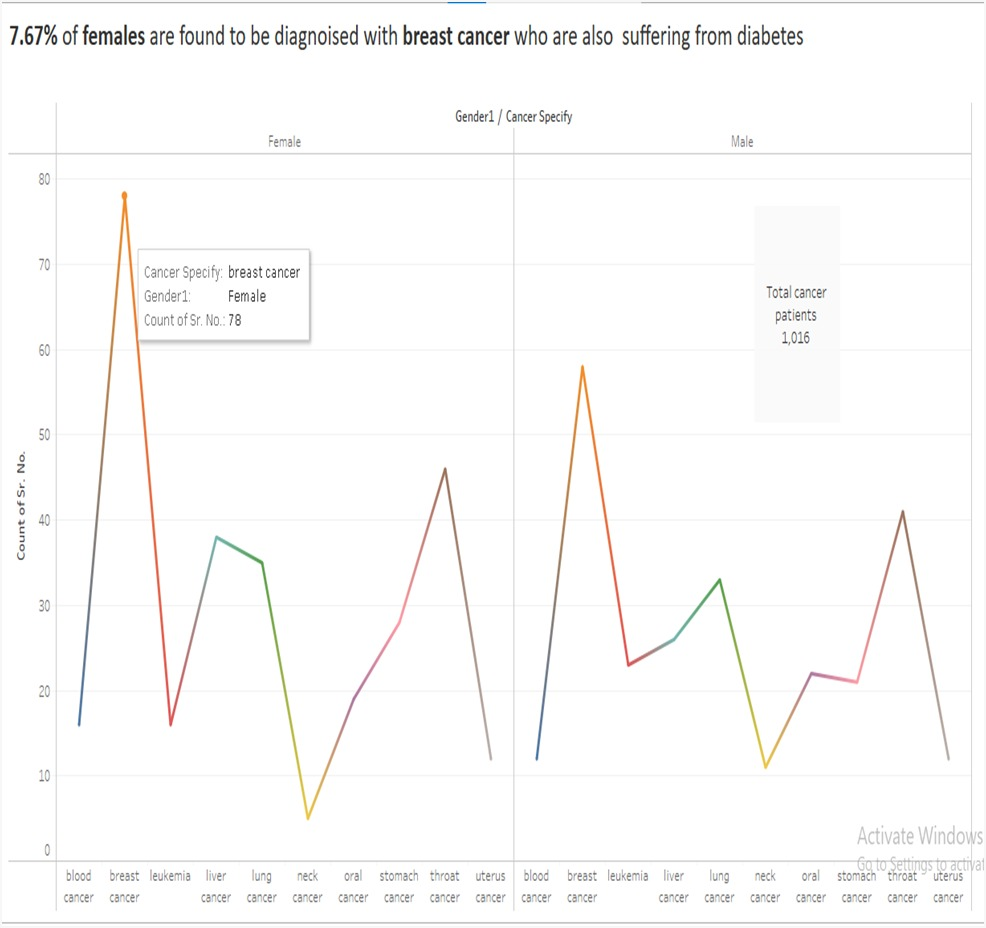
7.67% of females are diagnosed with breast cancer who are already suffering from diabetes, whereas 5.85% of males are diagnosed with breast cancer. The next highest number of cancer cases with diabetes patients are found in “throat cancer.” With consideration of follow-up data, we have 1 patient who died due to breast cancer from SGRDUHS Amritsar, Punjab hospital.
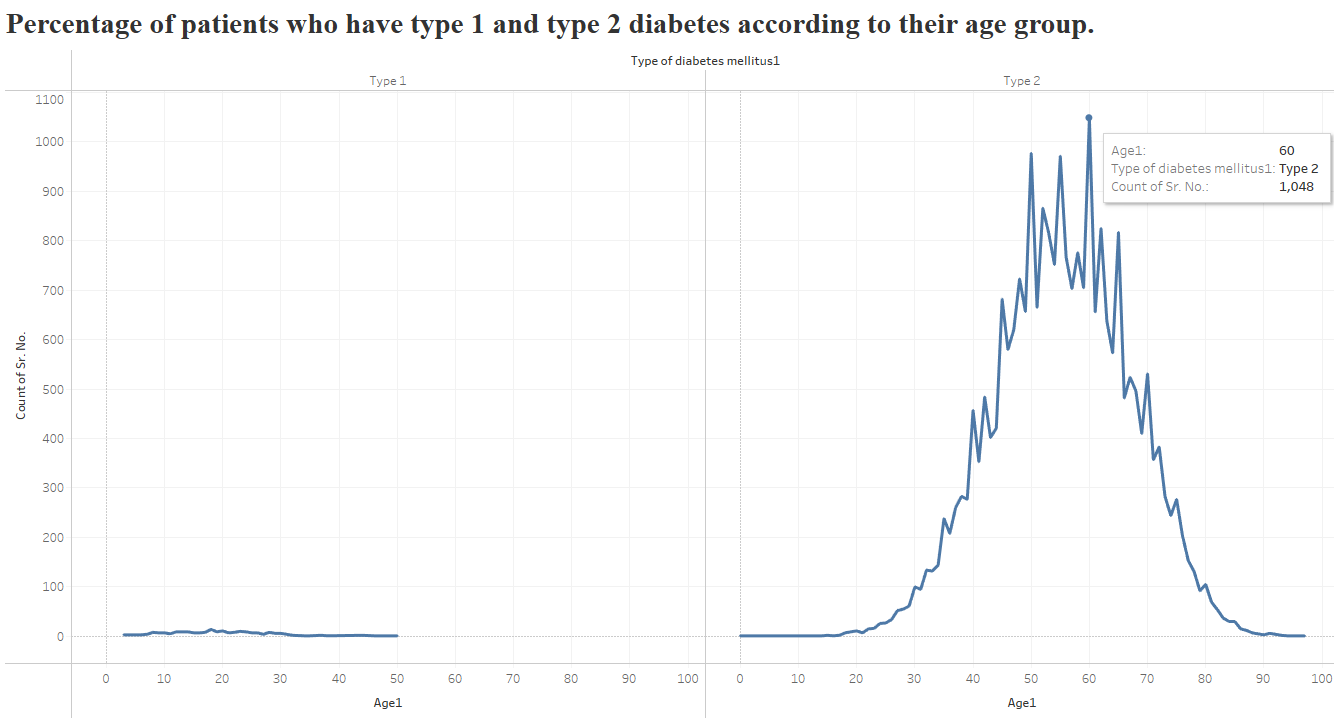
Type 2 : 1048 cases
This age group shows the highest predisposition to Type 2 diabetes, highlighting the need for vigilant monitoring.
Type 2 : 977 cases
A significant portion of this age group is affected by Type 2 diabetes, underscoring the importance of proactive health management.
Type 1 : 14 cases
Though rare, Type 1 diabetes in this young age group stresses the need for early detection and intervention.
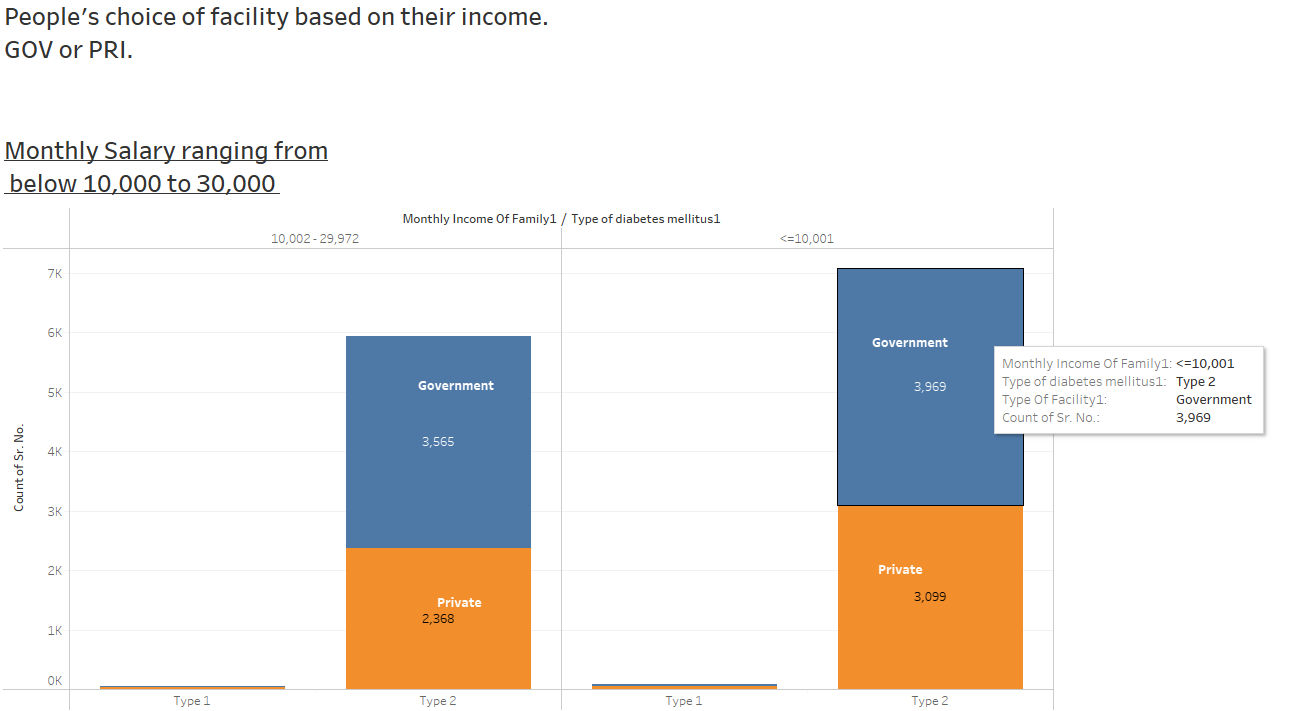
Government: 3565 cases
Private: 2368 cases
Higher-income families tend to utilize private facilities, though government facilities still see significant use.
Government: 3969 cases
Private: 3099 cases
Lower-income families rely heavily on government facilities, with substantial usage of private options as well.
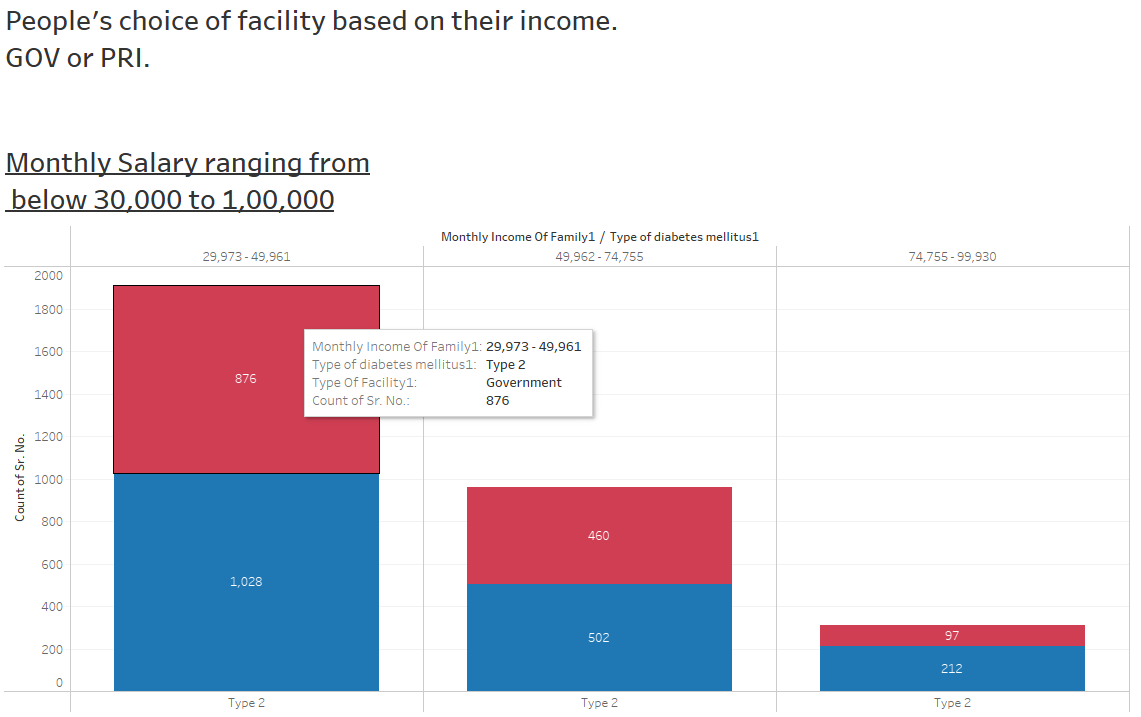
Government: 876 cases
Private: 1,028 cases
Middle-income families slightly favor private facilities, but government facilities also see considerable usage.
Government: 460 cases
Private: 502 cases
Higher-income families tend to use private facilities, with government services still in demand.
Government: 97 cases
Private: 212 cases
Top earners show a balanced use of both government and private facilities for Type 2 diabetes care.
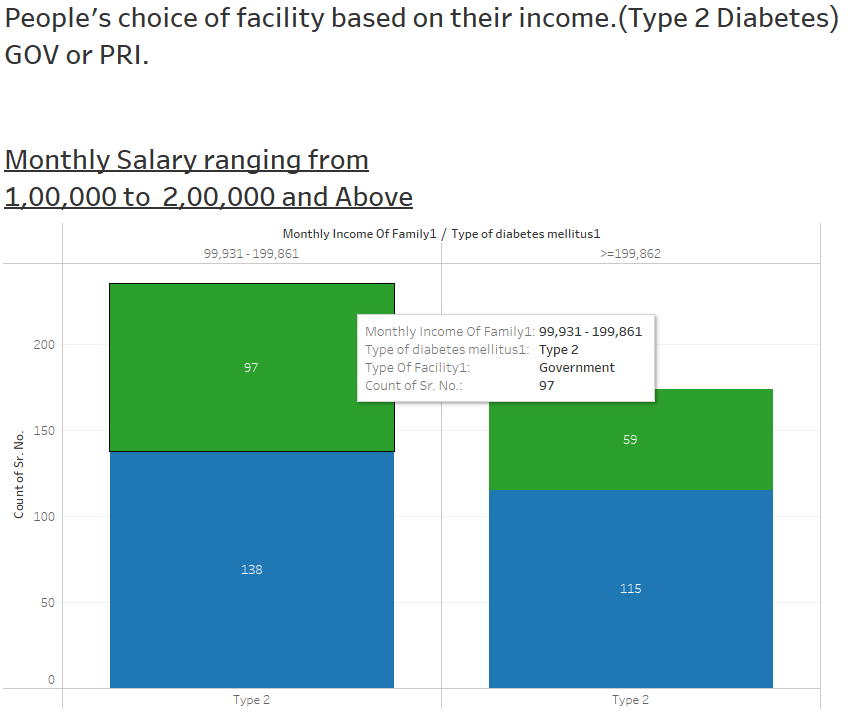
Government: 97 cases
Private: 138 cases
High-income families tend to prefer private facilities, with some reliance on government services.
Government: 59 cases
Private: 115 cases
Wealthiest individuals show a clear preference for private facilities over government options for Type 2 diabetes care.
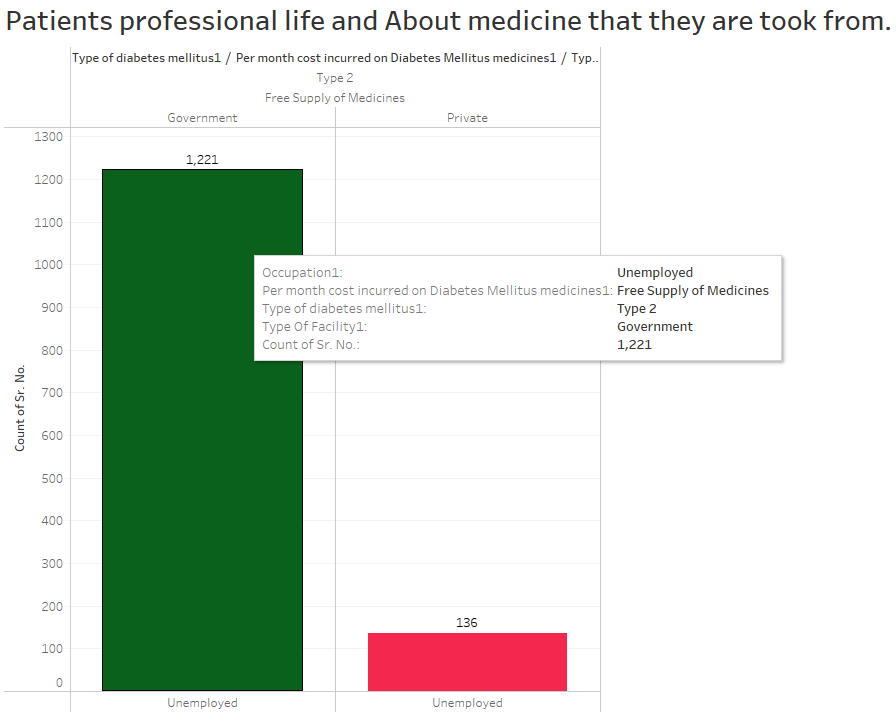
Unemployed
Free Medicine Supply
Facility: Government
The majority of unemployed patients rely on government facilities for free diabetes medicine.
Unemployed
Free Medicine Supply
Facility:Private
A smaller number of unemployed patients access free diabetes medicine through private facilities.
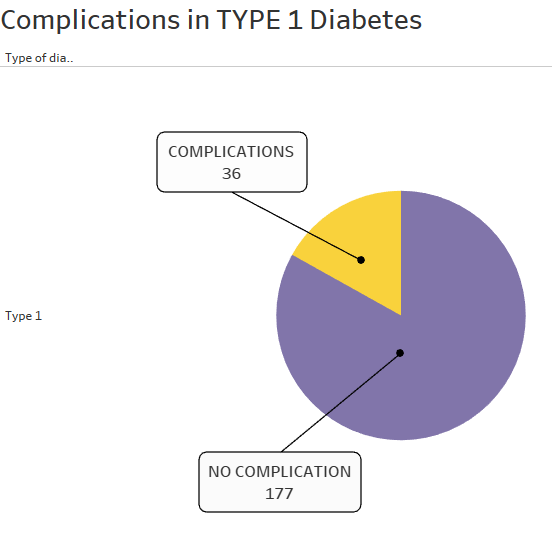
36
A small portion of Type 1 diabetes patients face complications, requiring closer medical attention.
177
The majority of Type 1 diabetes patients manage their condition without complications.
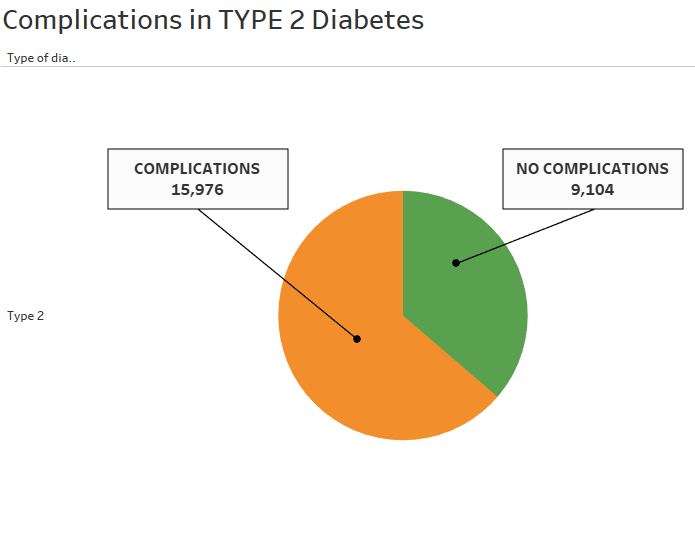
15,976
The high incidence of complications in Type 2 diabetes highlights the need for targeted interventions and vigilant management strategies.
9,104
The substantial number of patients without complications suggests effective disease management in a significant portion of Type 2 diabetes cases.
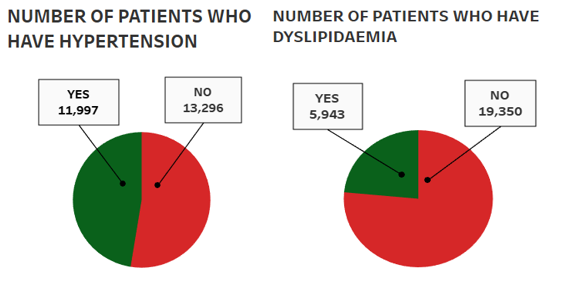
YES-11,997
NO-13,296
Nearly equal distribution of hypertension complications underscores the importance of routine blood pressure monitoring and management in diabetic patients.
YES-5,943
NO-19,350
Dyslipidaemia complications are less common, highlighting effective lipid management but with room for improvement.
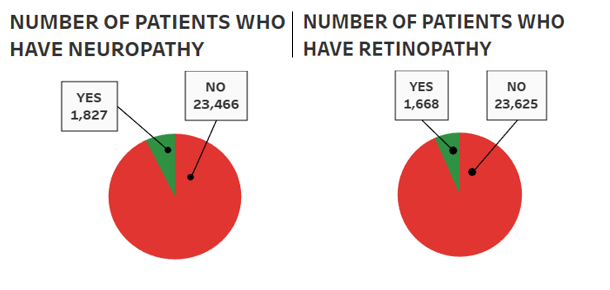
YES-1,827
NO-23,466
The lower incidence of neuropathy suggests that nerve-related complications are being managed effectively among patients.
YES-1,668
NO-23,625
The relatively low occurrence of retinopathy indicates that most patients maintain good retinal health.
70
Type 1 diabetes is less prevalent among inactive patients, but physical activity remains crucial for overall health.
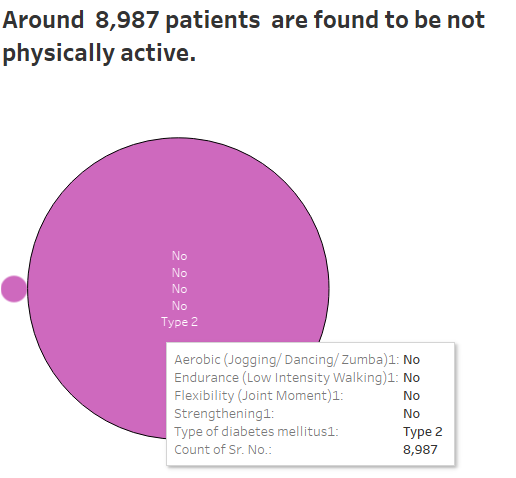
8,987
A significant portion of Type 2 diabetes cases are associated with inactivity, highlighting the need for increased physical activity to manage and prevent complications.
3
Minimal participation in physical activity among Type 1 patients suggests a potential area for improvement in lifestyle interventions.
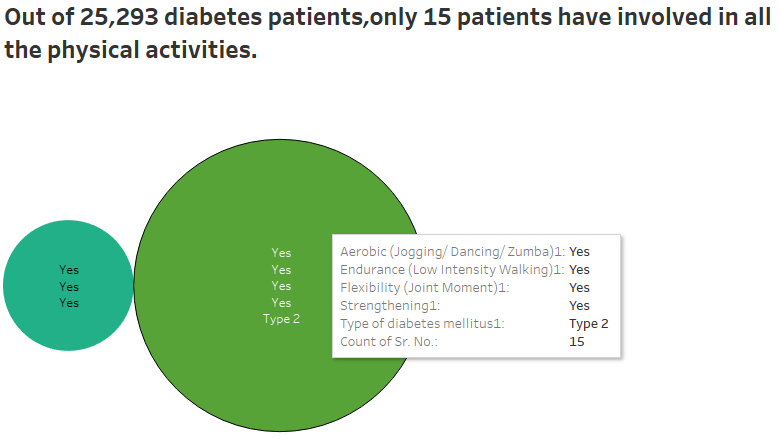
15
Limited physical activity among Type 2 patients indicates a need for increased focus on exercise in diabetes management.
Type 2 : 1048 cases
This age group shows the highest predisposition to Type 2 diabetes, highlighting the need for vigilant monitoring.
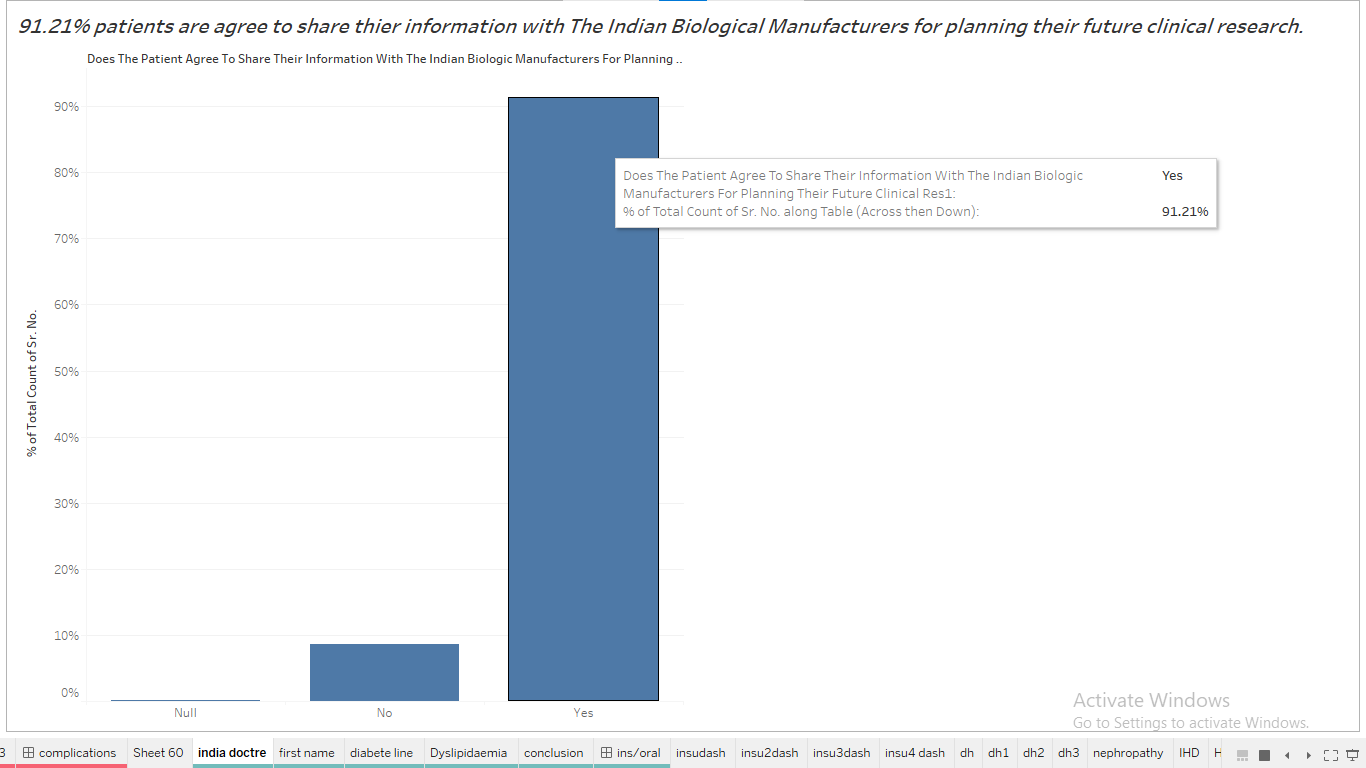
YES - 91.21%
Patients who have agreed to plan their future clinical research Indian biological manufacturers are in the percentage of 91.21%.
NO - 8.58%
8.58% patients did not agree to share their information with the Indian biological manufacturers for planning their future clinical research.
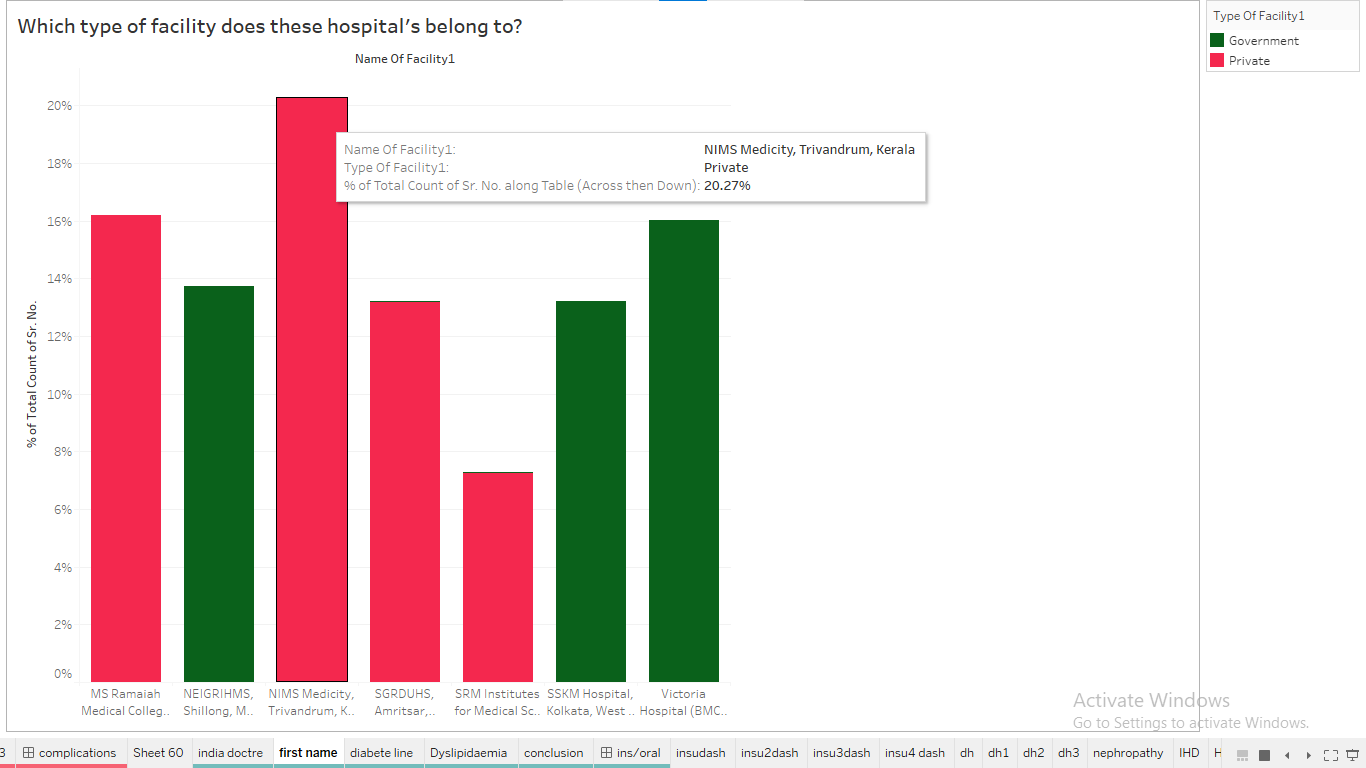
NIMS - 20.27%
SRM - 7.30%
Highest and lowest in private would be NIMS for highest and SRM as the lowest.
Victoria - 16.03%
SSKM - 13.21%
Highest and lowest in government would be victoria for highest and SSKM as the lowest.
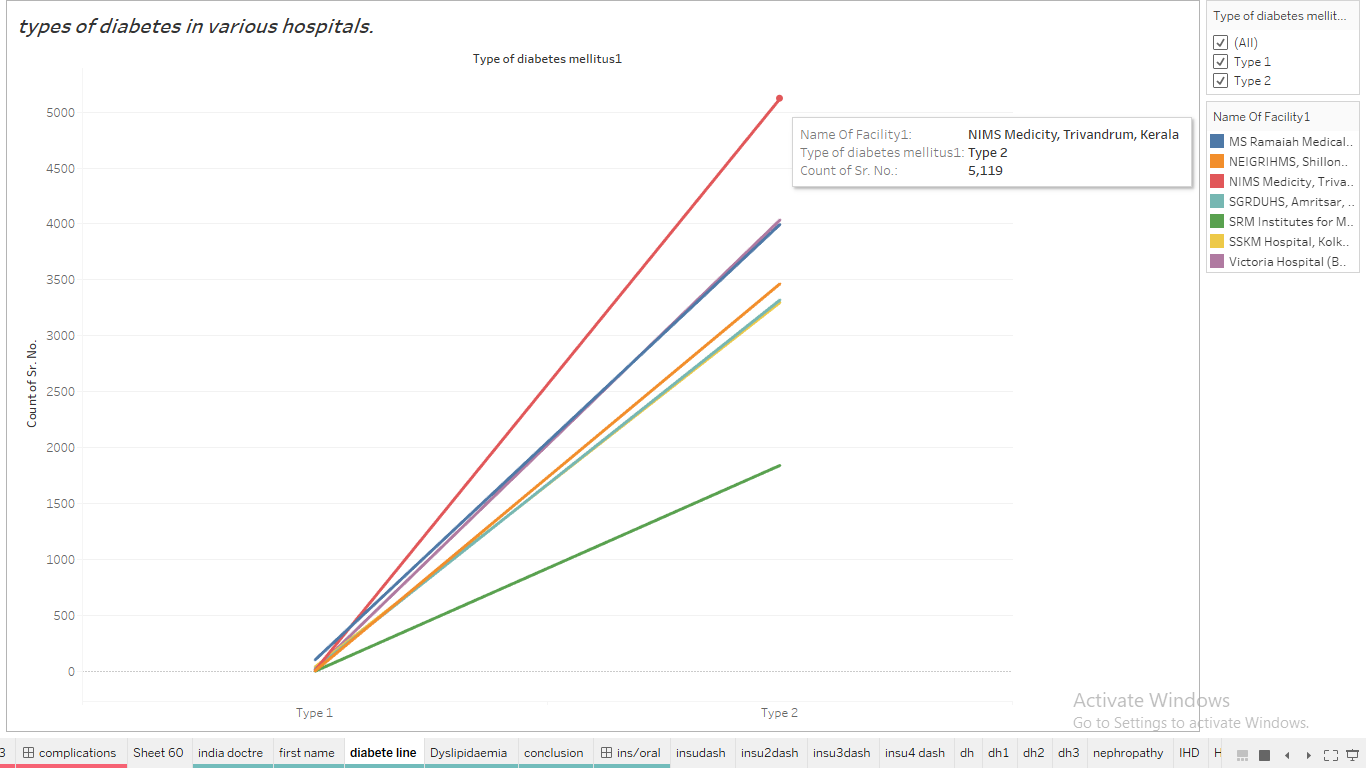
1,843
Lowest type 2 diabetes count is SRM Institutes for medical science, Chennai, Tamil Nadu as 1,843.
5,119
Highest type 2 diabetes count is NIMS Medicity, Trivandrum, Kerala with the count of 5,119.
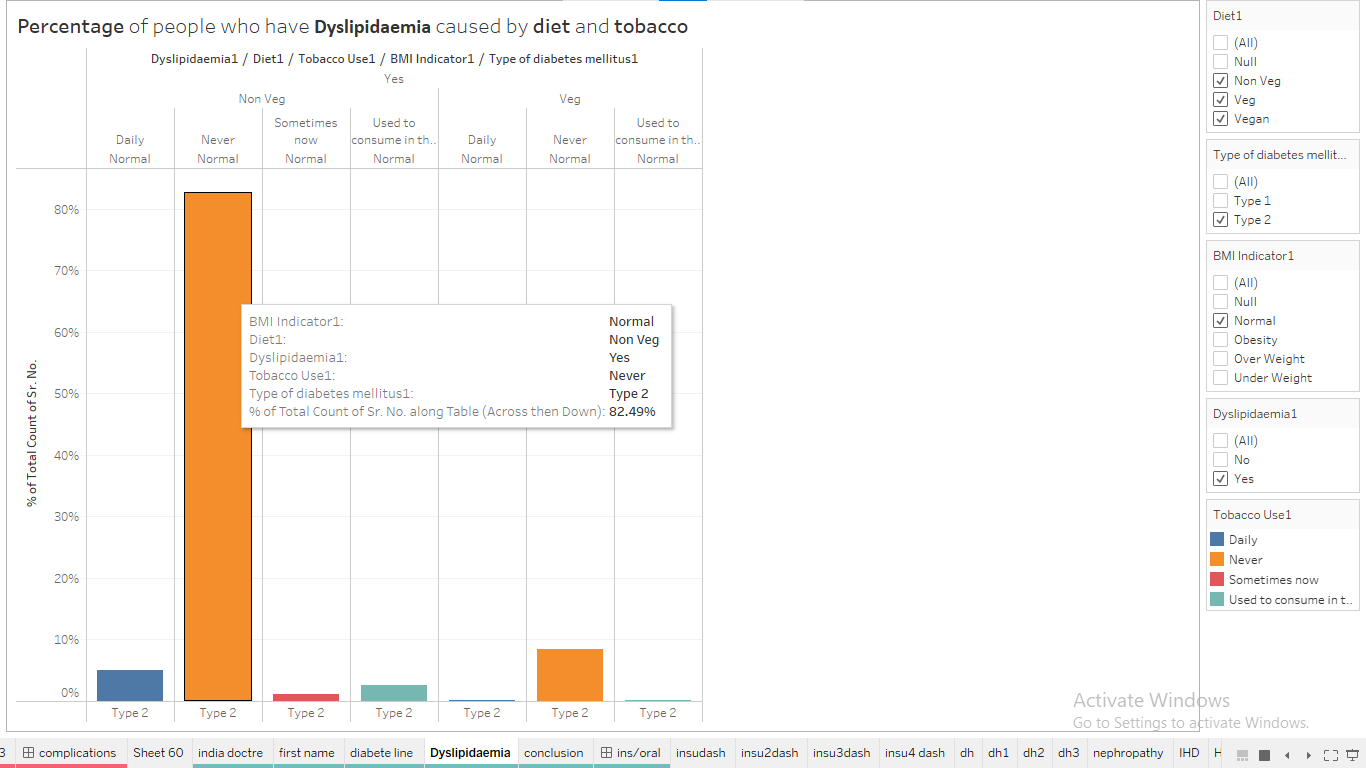
0.15%
Consumption of tobacco daily with type 2 with dyslipidaemia.
82.49%
No consumption of tobacco with type 2 diabetes with consisting of dyslipidaemia.
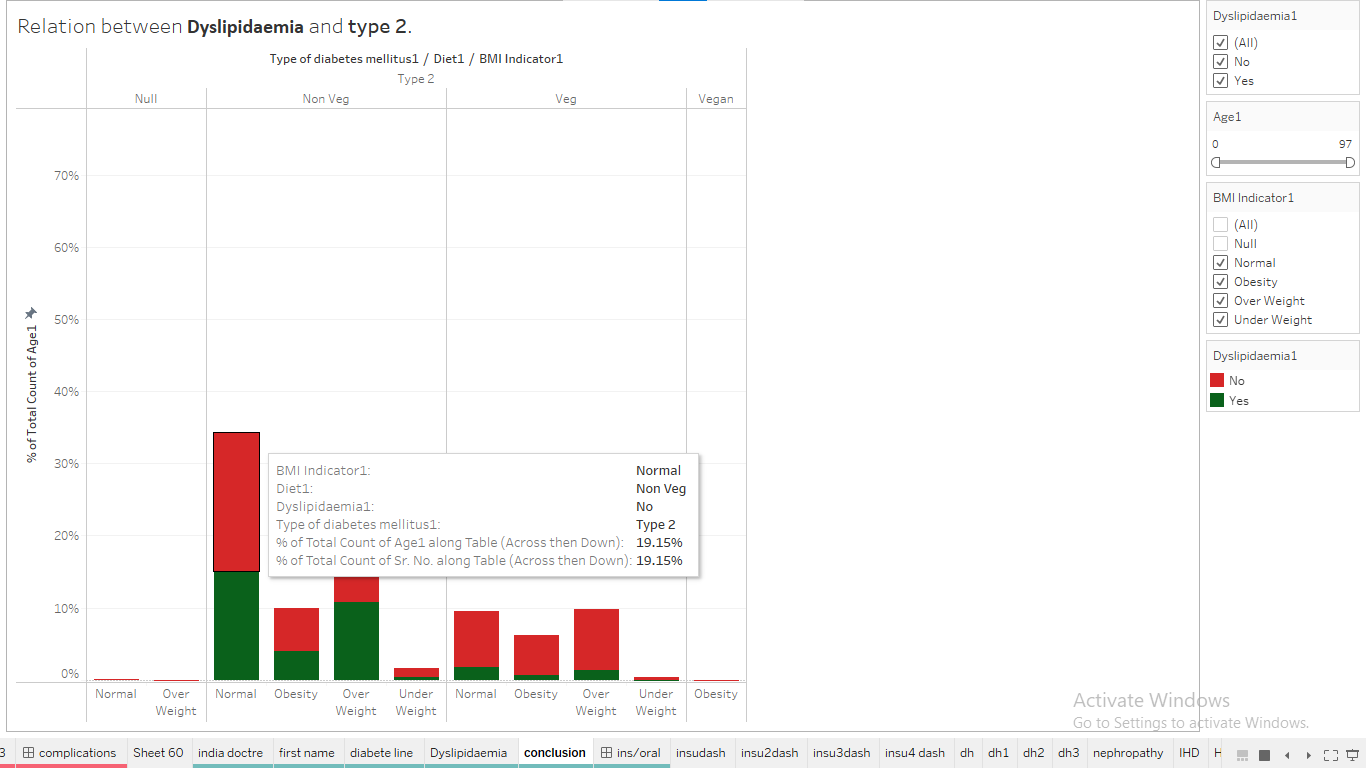
YES - 15.12%
NO - 19.15%
Highest consumption of non-veg with normal BMI indicator with type 2 diabetes.
YES - 0.41%
NO - 1.19%
The lowest consumption of non-veg with BMI indicator as underweight with type 2 diabetes .
YES - 1.81%
NO - 7.76%
Highest consumption of veg with normal BMI indicator with type 2 diabetes.
YES - 0.04%
NO - 0.29%
Lowest consumption of veg with underweight BMI indicator with type 2 diabetes.
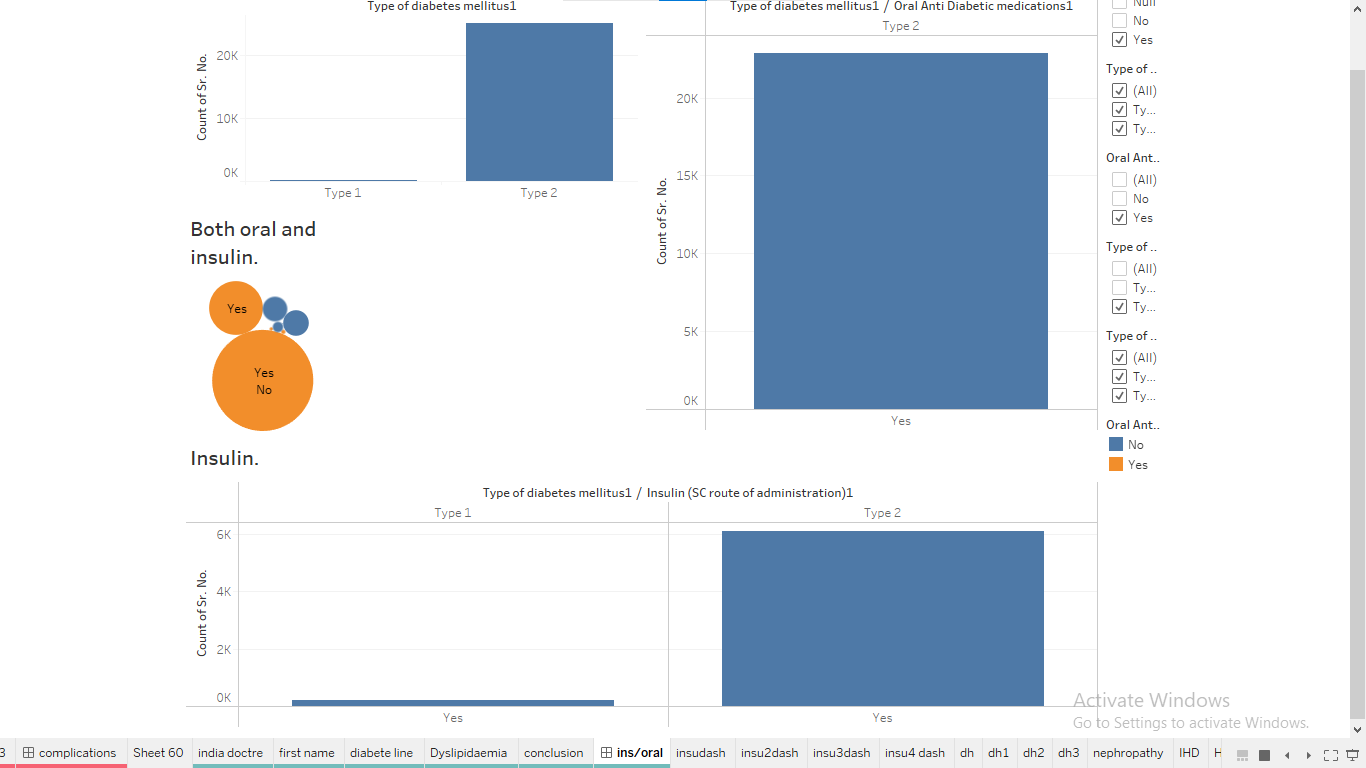
36
The total percentage of patients taking both oral and insulin are 19.92%.
22,873
The majority of patients taking oral anti diabetic medication with type 2 diabetes is 22,873.
212 and 6,099
The total count of insulin in the 25,293 data would be 212 for type 1 and 6,099 for type 2.
213 and 25,080
The total count of type 1 is 213 and Type 2 is 25,080 in the whole data with the count of 25,293.
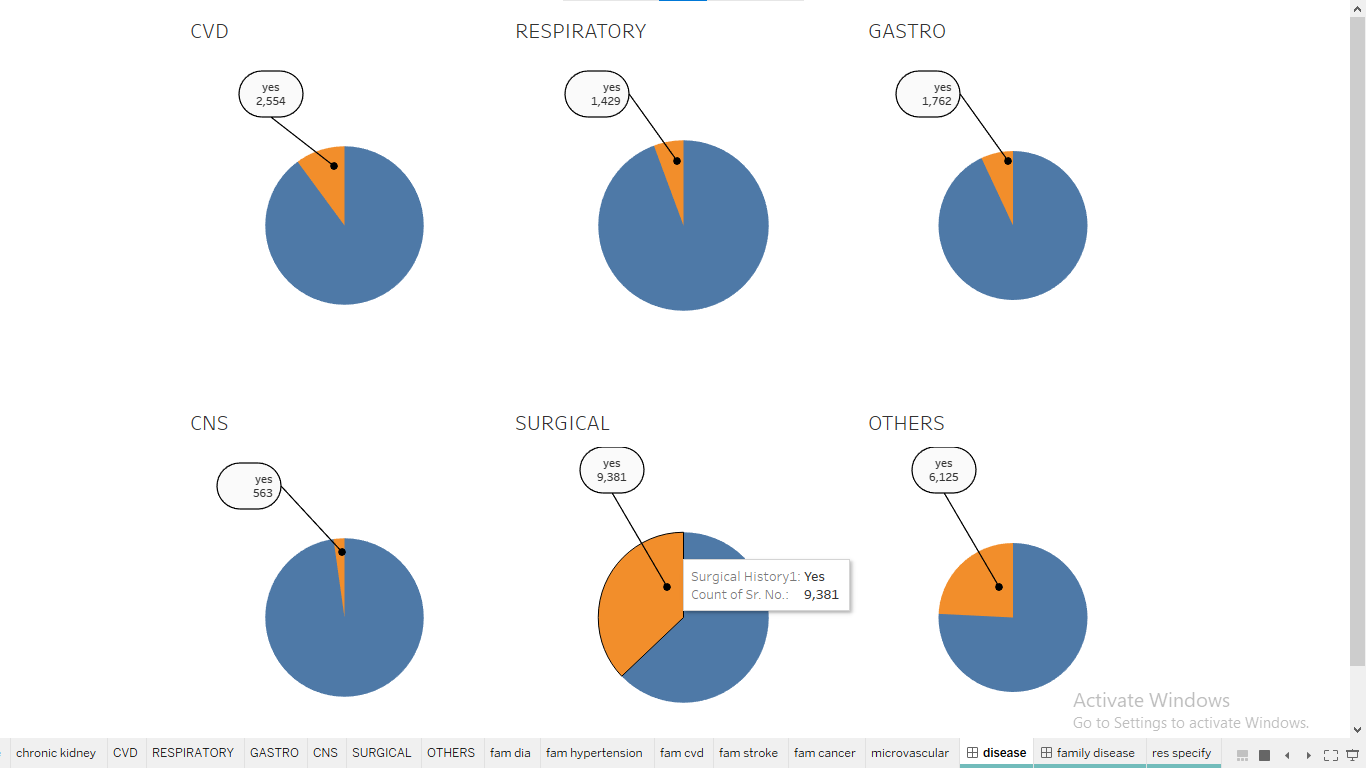
YES - 9,381
NO - 15,912
The highest count in diseases would be Surgical with the yes count as 9,381 and no count as 15,912.
YES - 563
NO - 24,730
The lowest count in diseases would be CNS with the yes count as 563 and no count of 24,730.
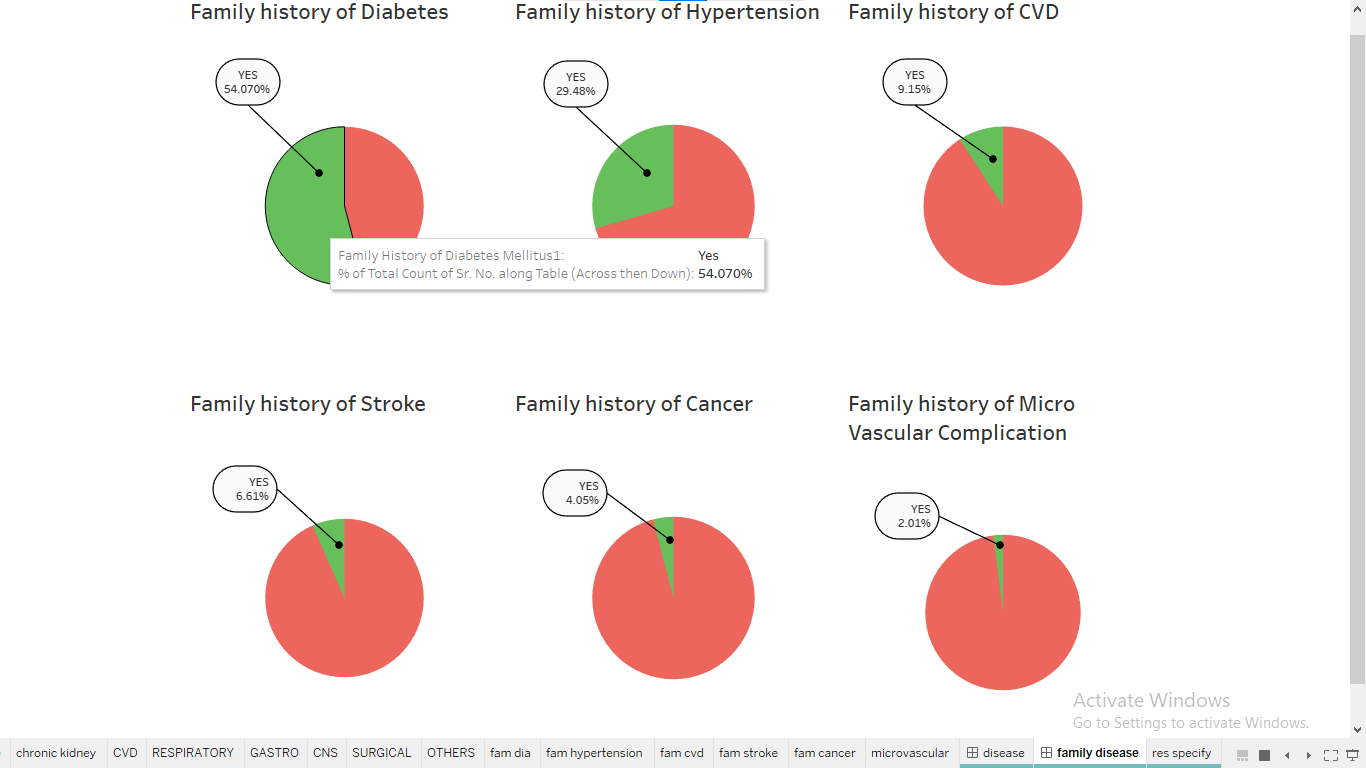
YES - 54.070%
NO - 45.930%
The highest count in family history would be diabetes at the percentage of 54.070%.
YES - 2.01%
NO - 97.99%
The lowest in the count of family history would be micro vascular compplication in the percentage of 97.99%.
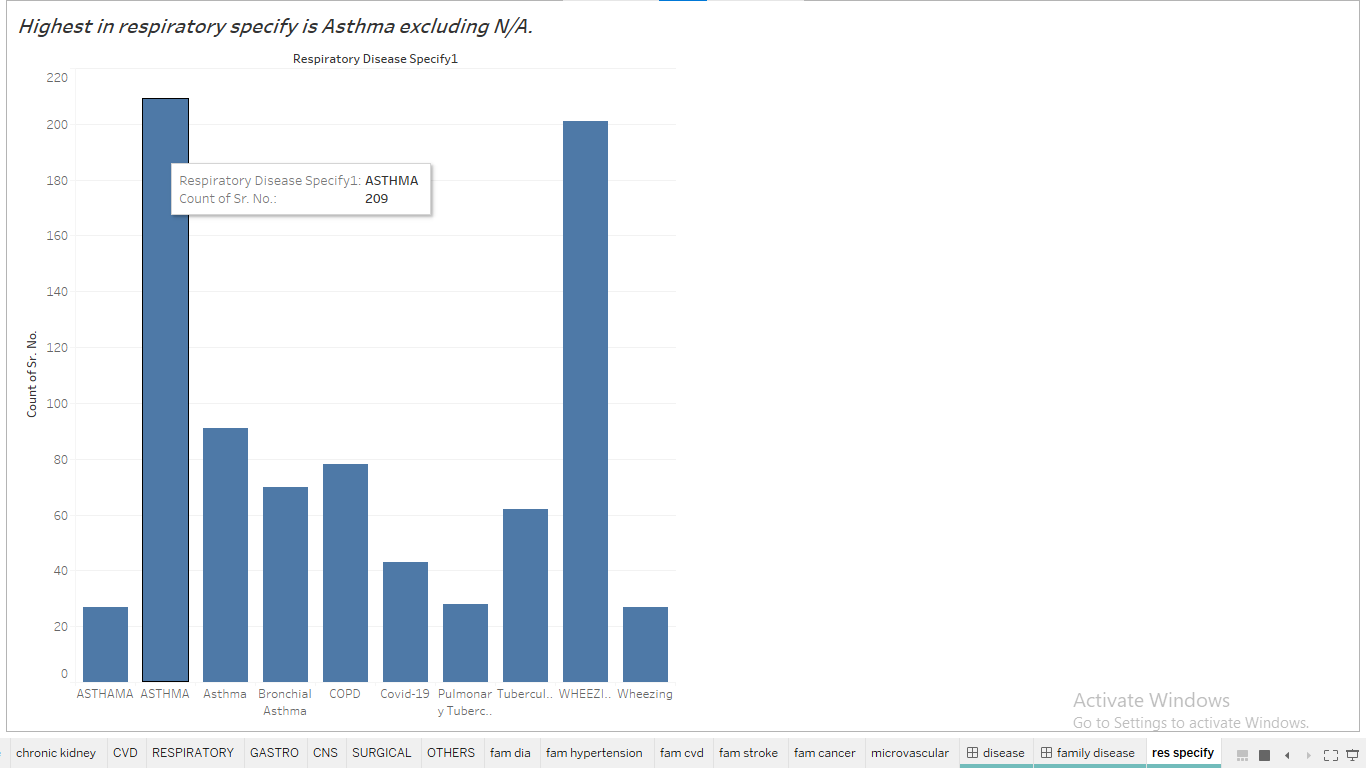
NO - 327
The highest count in respiratory specify would be Asthama is 327.
NO - 28
The lowest in respiratory is pulmonary tuberculosis in the count of 28.
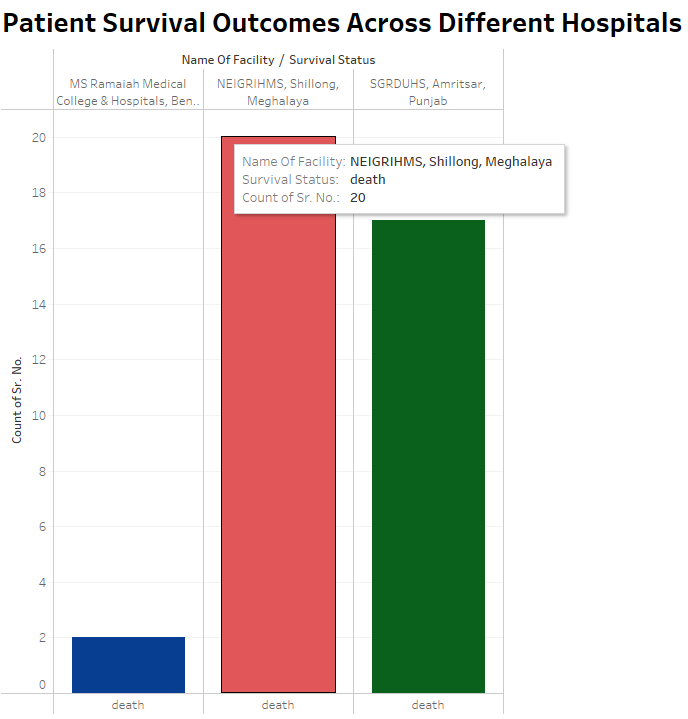
2
This facility recorded a total of 2 patient deaths, indicating relatively low mortality among the cases reported.
20
A significant number of deaths were recorded, totaling 20, which suggests a higher mortality rate among patients treated.
17
The facility saw 17 deaths, reflecting a notable mortality rate in the patient outcomes reported.
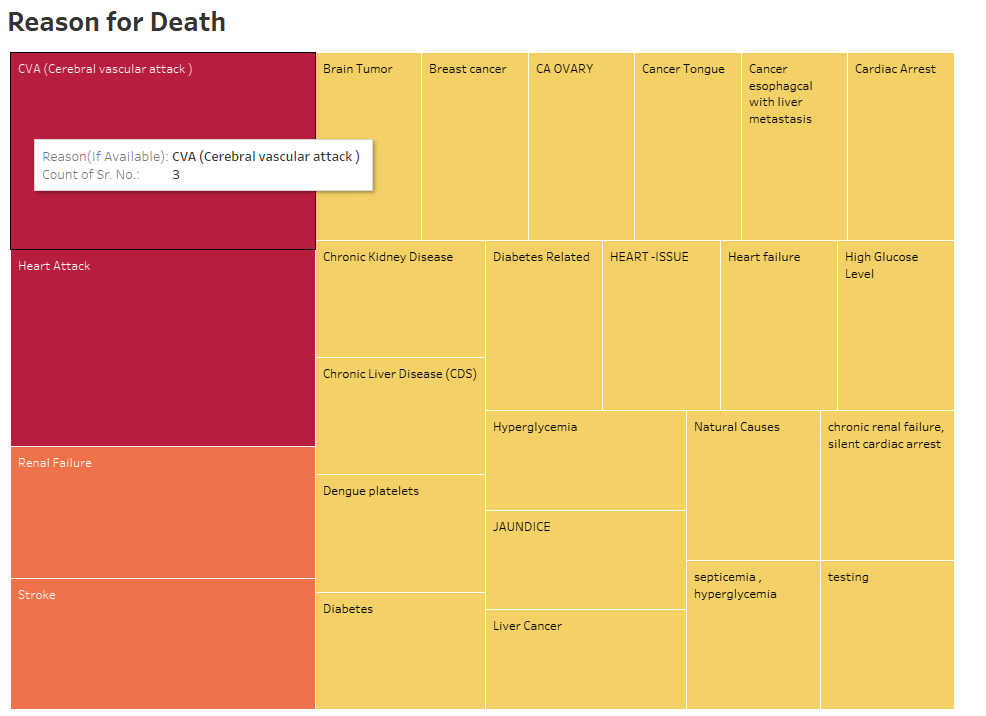
3
The incidence of death due to CVA & Heart Attack is recorded as 3 cases.
2
2 deaths, mainly due to CVA & heart attack.
Acceptance of Terms
By accessing and using this website, you agree to be bound by the terms and conditions set forth below. If you do not agree to these terms, please do not use the website.
User Accounts and Security:
Each hospital has been provided with unique login credentials. You are responsible for maintaining the confidentiality of your login information and for all activities that occur under your account. You agree to notify us immediately of any unauthorized use of your account or any other breach of security.
Access to Reports and Datasets:
Access to analytical reports and datasets is restricted to authorized users only. Each hospital can only access its own reports and datasets. Attempting to access data or reports of other hospitals is strictly prohibited and may result in termination of access rights and legal action.
Use of Data:
The data and reports provided on this website are intended for internal use by the respective hospitals only. They are not to be shared, reproduced, or distributed without explicit permission from the website administrators.
Data Privacy and Protection:
We are committed to protecting the privacy and security of the patient data contained in the reports and datasets. Any misuse or unauthorized sharing of this data is a violation of these terms and may result in legal consequences.
Feedback and FAQs:
We provide a feedback form for users to ask questions or provide comments. The information submitted through this form may be used to improve the services offered on this website. Please refrain from submitting sensitive or confidential information through the feedback form.
Changes to Terms:
We reserve the right to modify these terms and conditions at any time. Any changes will be posted on this page, and it is your responsibility to review these terms regularly. Continued use of the website after any such changes constitutes your acceptance of the new terms.
Limitation of Liability:
The website and its content are provided on an "as is" basis without warranties of any kind. We do not guarantee the accuracy, completeness, or reliability of the reports and datasets. We are not liable for any damages resulting from the use or inability to use the website or its content.
Contact Information:
If you have any questions about these terms and conditions, please contact us at chairmanoffice@indiancst.in.