Global Digital Platform Successful Implementation's In Pan India

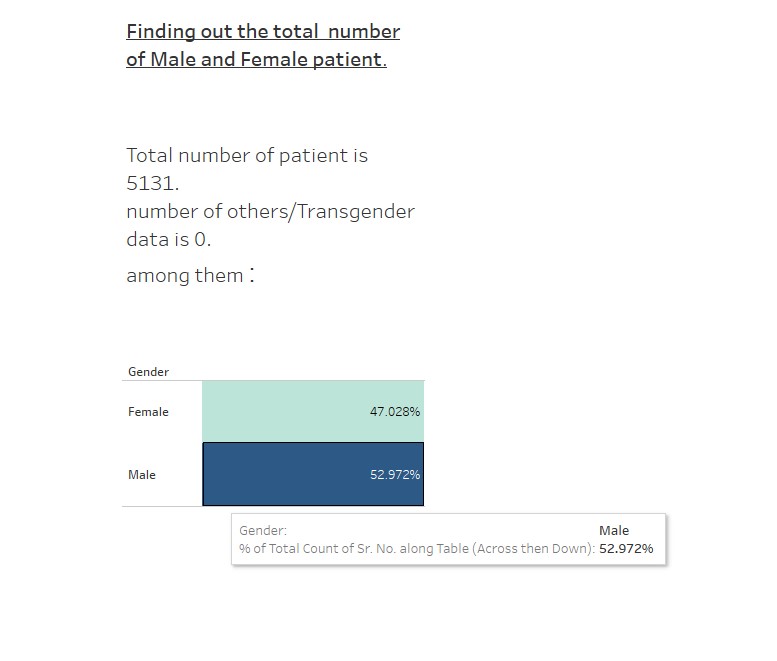
52.972%
This visualization provides insight into the percentage of Male Patients in hospital
47.028%
This visualization provides insight into the percentage of Female Patients in hospital
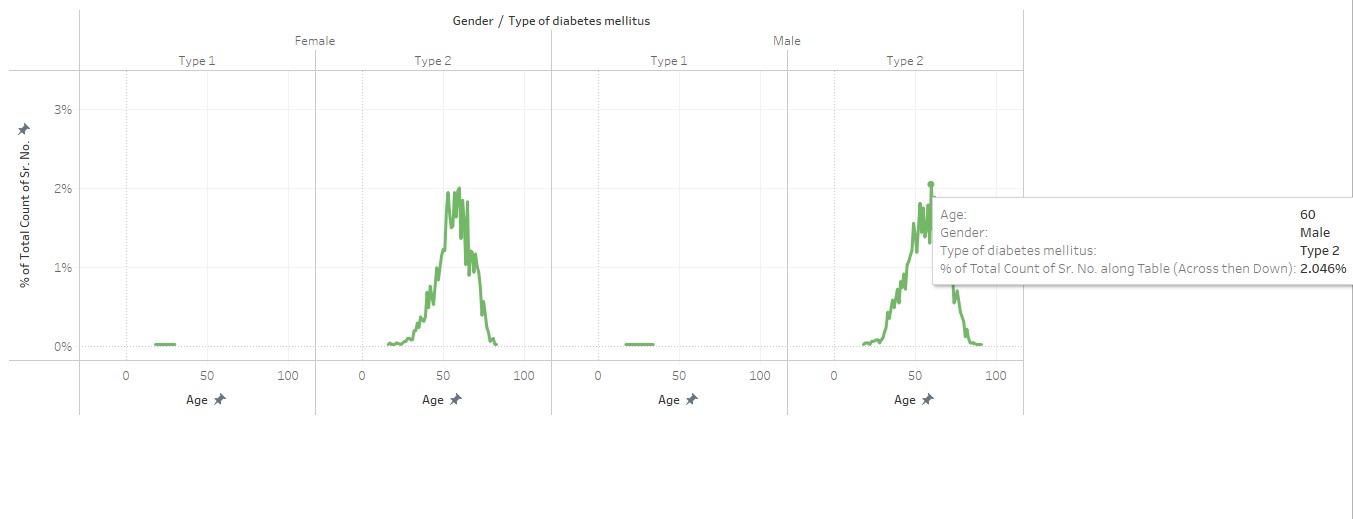
2.046%
This visualization provides insight into the percentage of Male age 60 and suffering from Type 2
2.007%
This visualization provides insight into the percentage of Female age 60 and suffering from Type 2
Father 0.008%
This visualization provides insight into the percentage of Family History of Type 1 diabetes and relation with patient
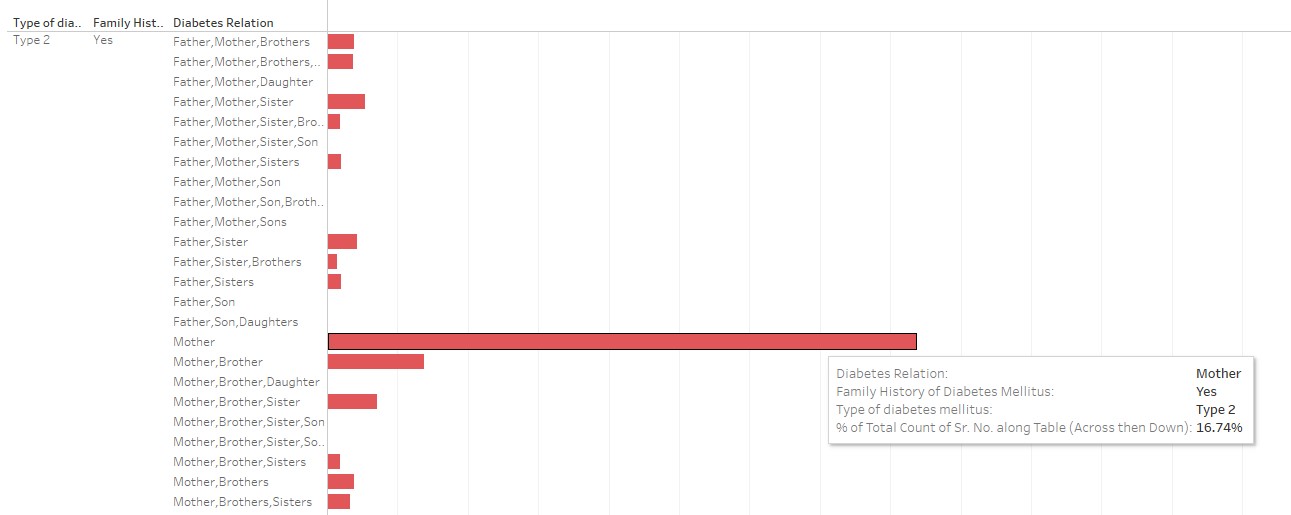
Mother 16.74%
This visualization provides insight into the percentage of Family History of Type 2 diabetes and relation with patient
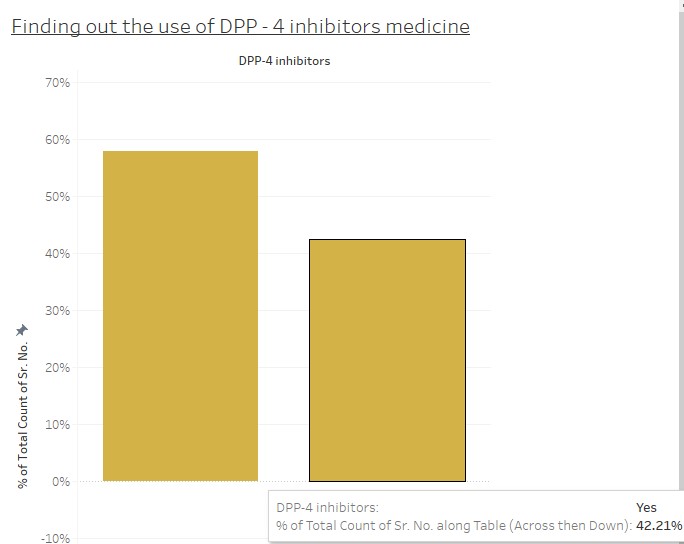
42.21%
DPP - 4 inhibitors is Most wanted oral medicine
0.06%
GLP-1 is the Least wanted oral medicine
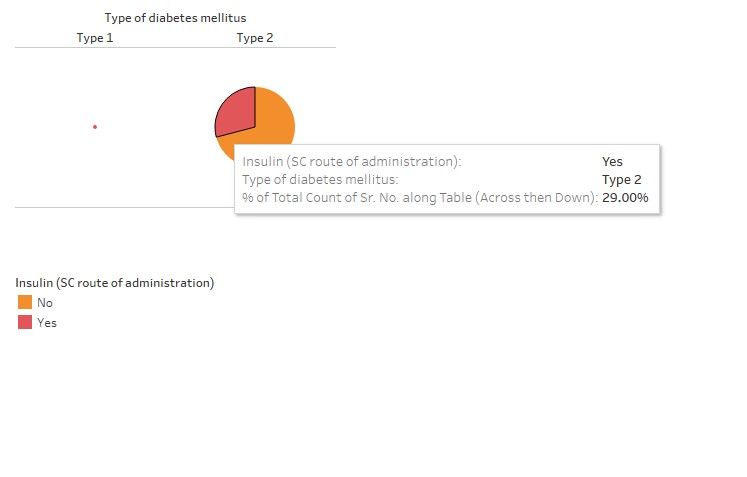
0.23%
This visualization provides insight into the percentage of Consumption of Insulin by Type 1
29.00%
This visualization provides insight into the percentage of Consumption of Insulin by Type 2
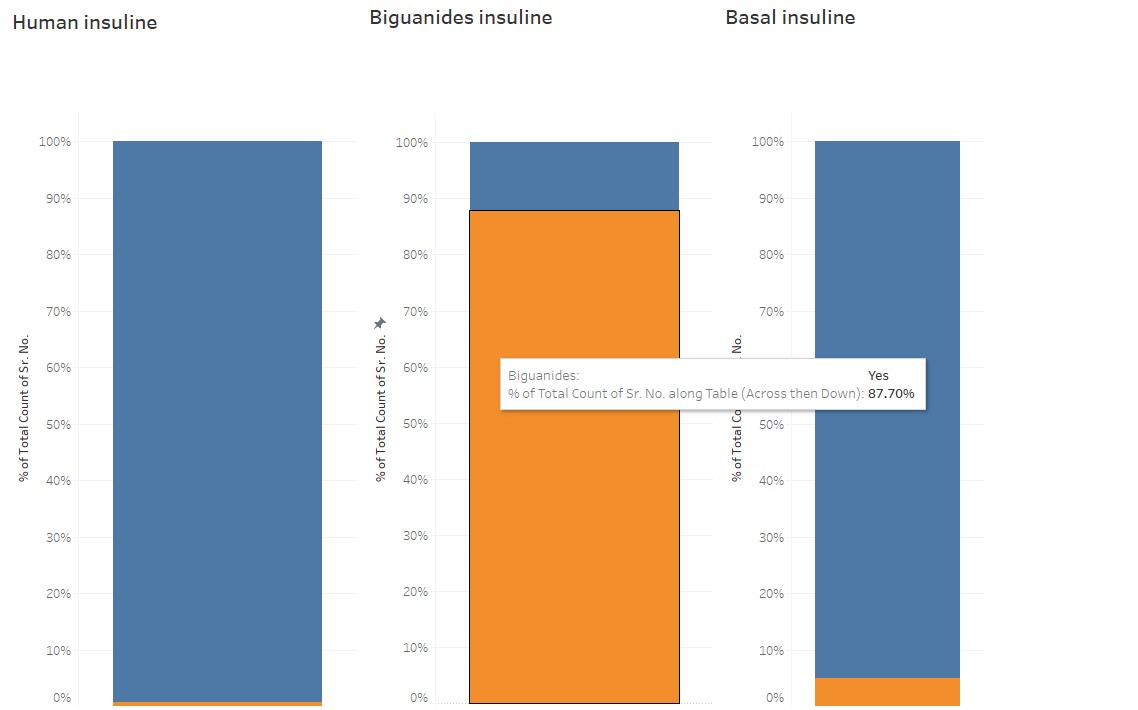
87.70%
This visualization provides insight into that Biguanides insuline is most wanted insuline
0.70%
This visualization provides insight into that Human insuline is Least wanted insuline
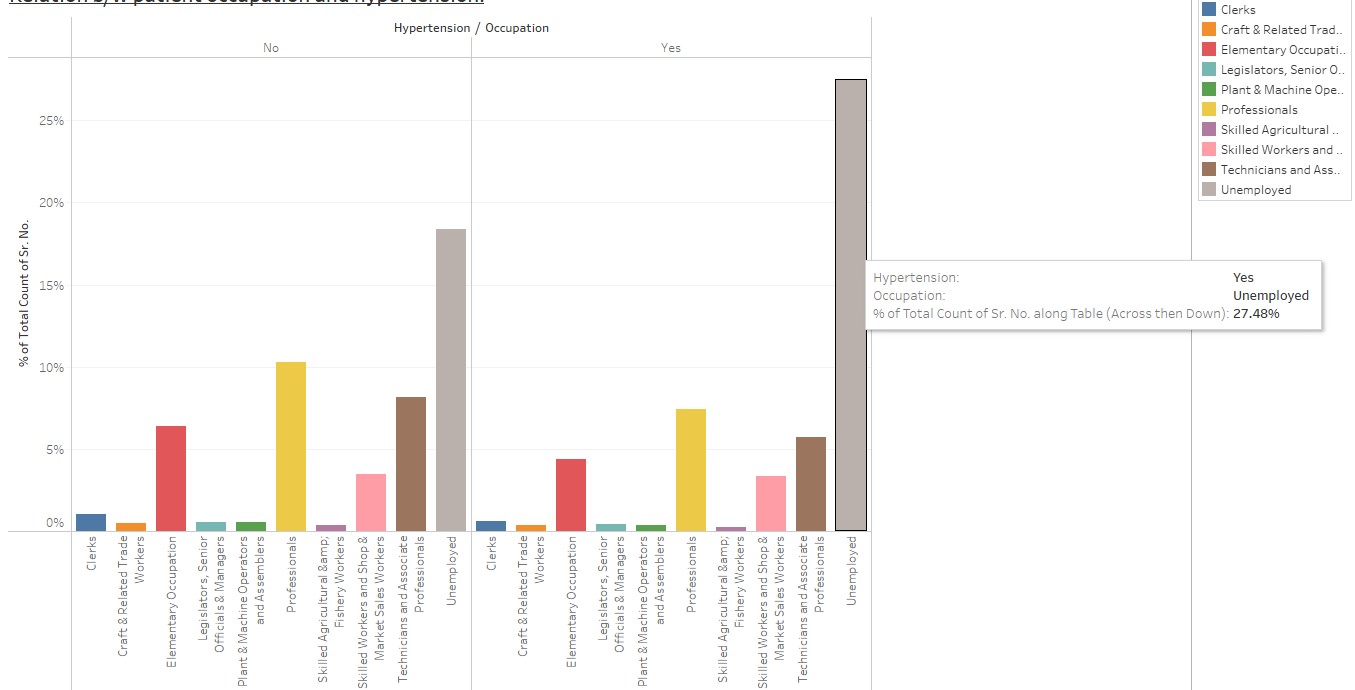
27.48%
patients occupation is unemployement and suffering from Diabetes has heigh percentage of hypertenstion
0.62%
patients occupation is clerks and suffering from Diabetes has least percentage of hypertenstion
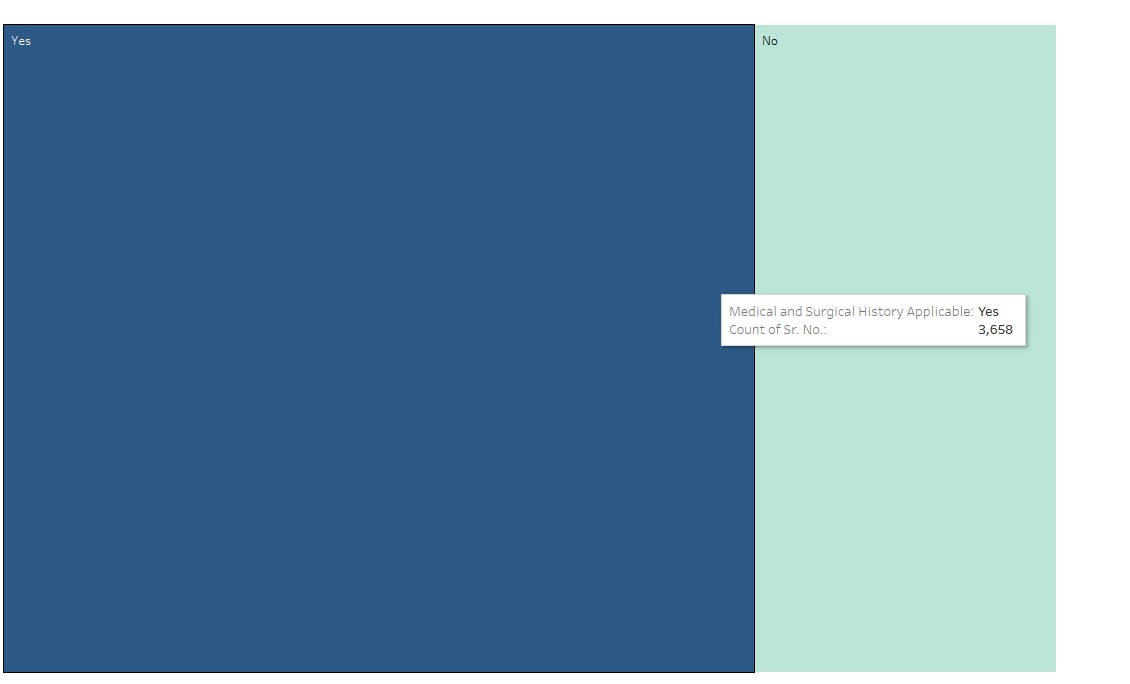
3,658 patients
This visualization provides insight into the count of patients where medical and surgery is applicable for patient.
1,473 patients
This visualization provides insight into the count of patients where medical and surgery is not applicable for Type 1 & 2 patient.
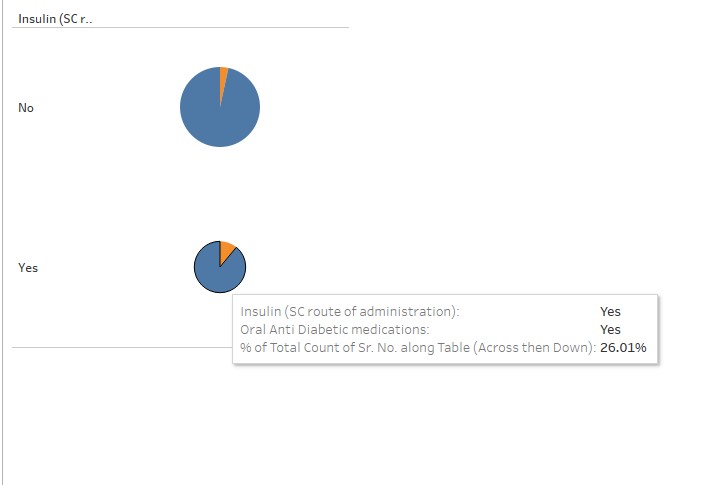
26.01%
This visualization provides insight into the percentage of consumption of both oral medicine and insulin
This visualization provides insight into the percentage of consumption of only oral medicine and only insulin
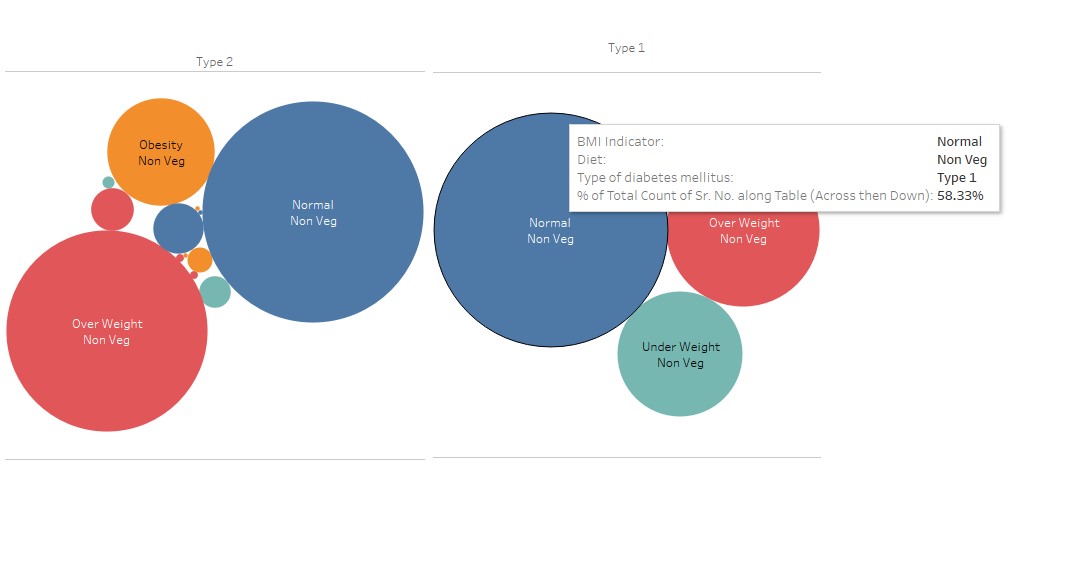
58.33%
This visualization provides insight into the Type 1 patients where BMI is normal and diet is non veg has heigh percentage when compare to other BMI indicators
45.59%
This visualization provides insight into the Type 2 patients where BMI is normal and diet is non veg has heigh percentage when compare to other BMI indicators
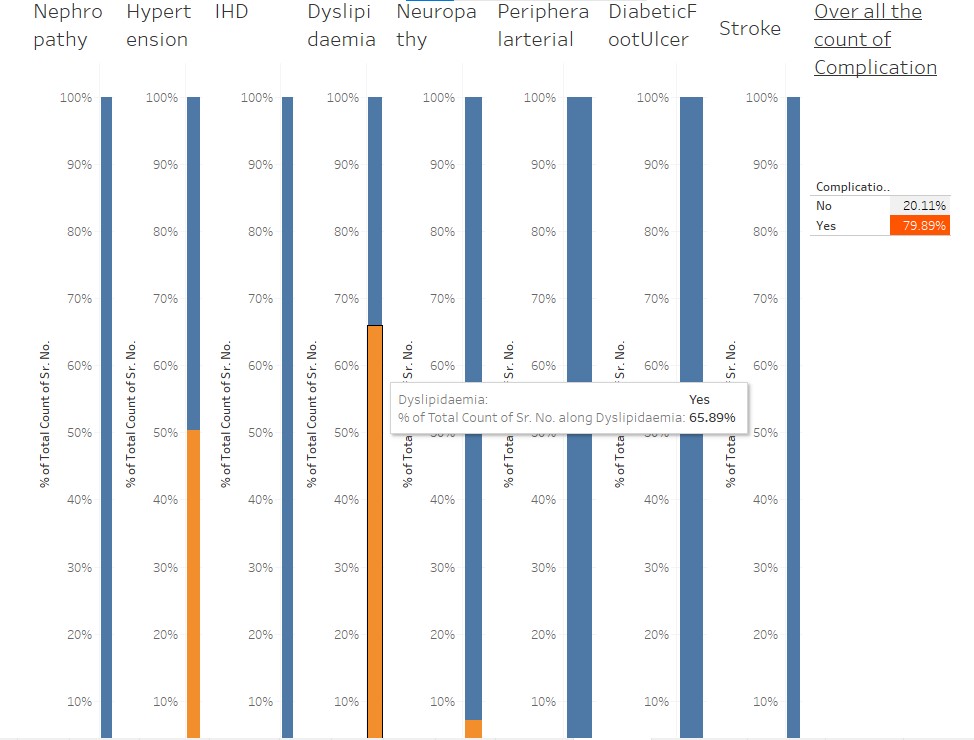
65.89%
Dyslipidemia has the heighest percentage of complicastions been suffering from patients.
0.18%
Peripheralarterial has the lowest percentage of complicastions been suffering from patients.
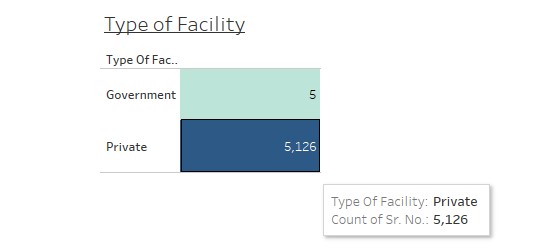
5
This visualization provides insight into that Government facility is proving only for 5 patients
5126
This visualization provides insight into that Private facility is proving for 5126 patients
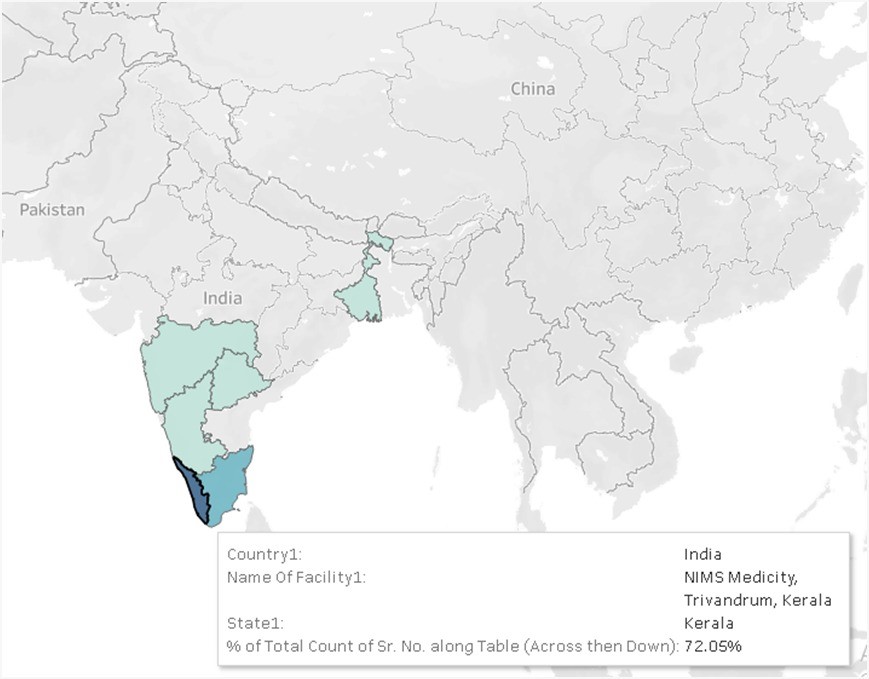
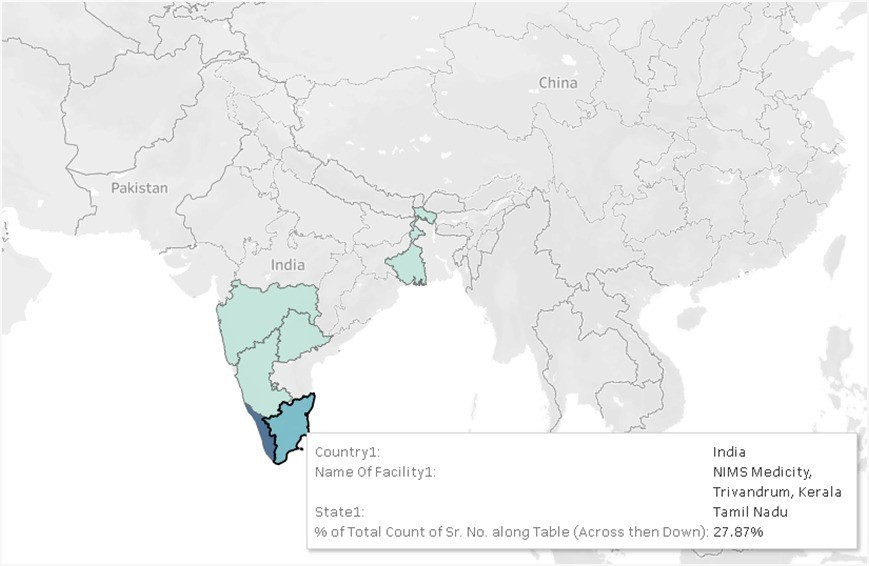
NIMS Medicity Trivandrum, Kerala has 72.05% of natives.
NIMS Medicity Trivandrum, Kerala has 72.05% of natives while 27.87% of them are from Tamil Nadu
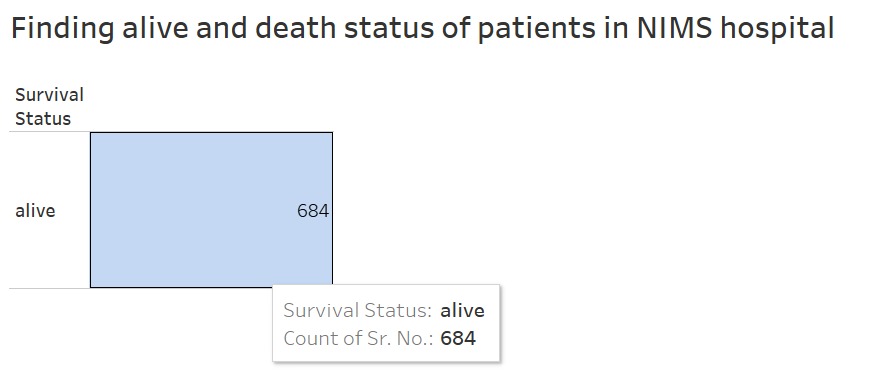
684
This visualization provides insight into the count of Patients where the survival status is alive
0
This visualization provides insight into the count of Patients where the survival status is death and the count is 0.
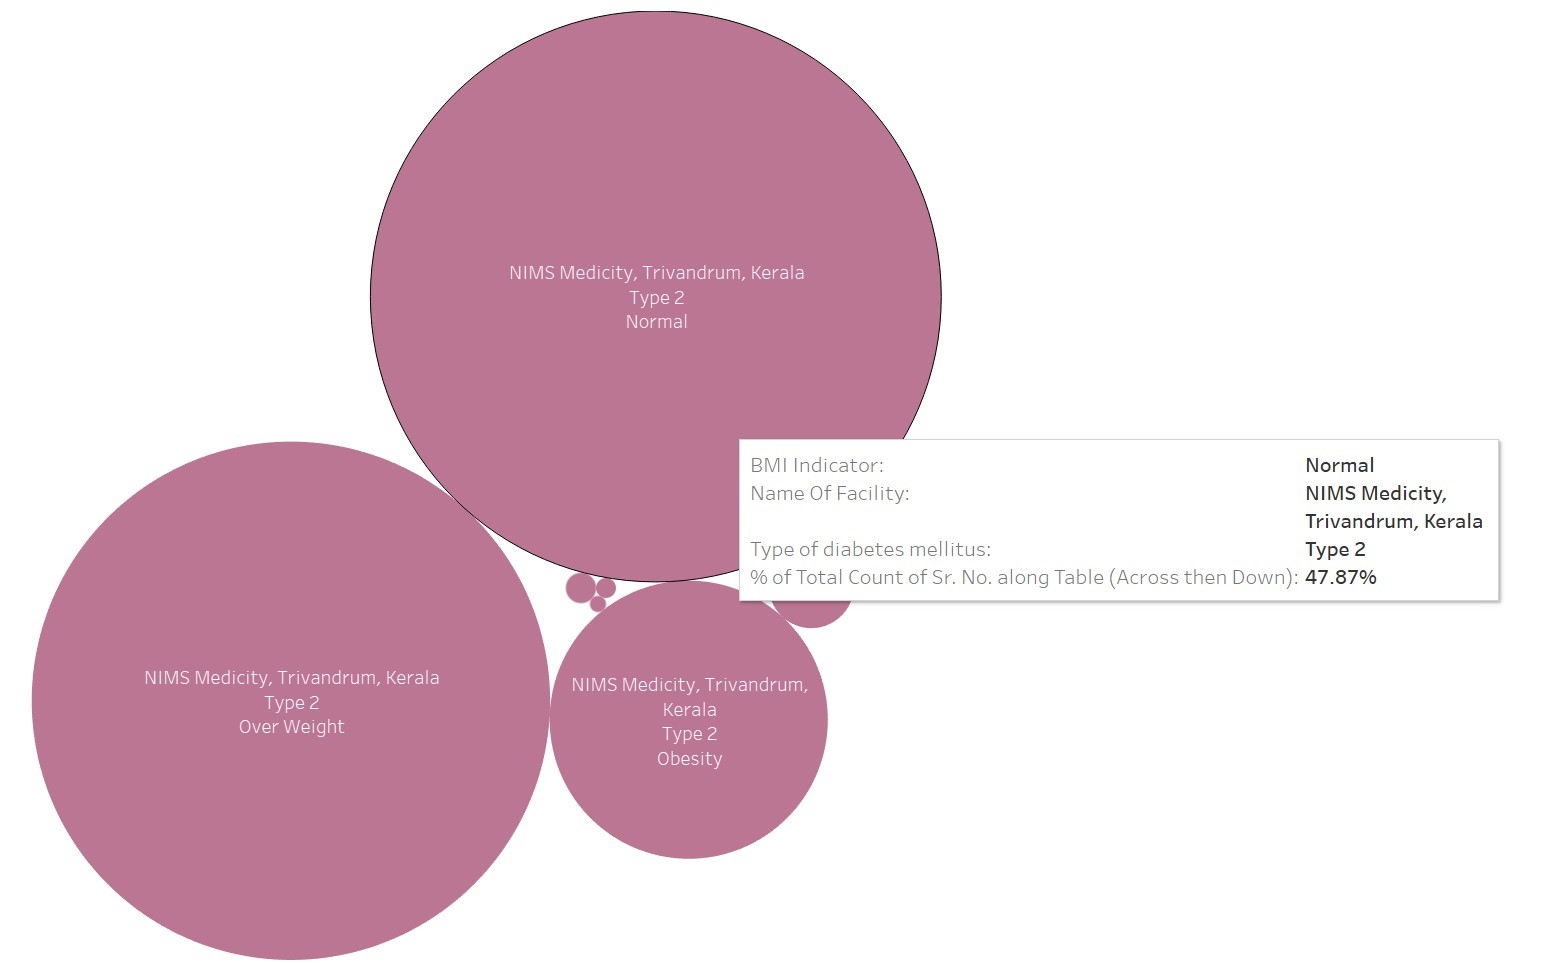
47.87%
This visualization provides insight into that the patients suffering from Type 2 and their BMI is normal had the heighest percentage.
7%
This visualization provides insight into that the patients suffering from Type 1 and their BMI is normal had the lowest percentage.
Acceptance of Terms
By accessing and using this website, you agree to be bound by the terms and conditions set forth below. If you do not agree to these terms, please do not use the website.
User Accounts and Security:
Each hospital has been provided with unique login credentials. You are responsible for maintaining the confidentiality of your login information and for all activities that occur under your account. You agree to notify us immediately of any unauthorized use of your account or any other breach of security.
Access to Reports and Datasets:
Access to analytical reports and datasets is restricted to authorized users only. Each hospital can only access its own reports and datasets. Attempting to access data or reports of other hospitals is strictly prohibited and may result in termination of access rights and legal action.
Use of Data:
The data and reports provided on this website are intended for internal use by the respective hospitals only. They are not to be shared, reproduced, or distributed without explicit permission from the website administrators.
Data Privacy and Protection:
We are committed to protecting the privacy and security of the patient data contained in the reports and datasets. Any misuse or unauthorized sharing of this data is a violation of these terms and may result in legal consequences.
Feedback and FAQs:
We provide a feedback form for users to ask questions or provide comments. The information submitted through this form may be used to improve the services offered on this website. Please refrain from submitting sensitive or confidential information through the feedback form.
Changes to Terms:
We reserve the right to modify these terms and conditions at any time. Any changes will be posted on this page, and it is your responsibility to review these terms regularly. Continued use of the website after any such changes constitutes your acceptance of the new terms.
Limitation of Liability:
The website and its content are provided on an "as is" basis without warranties of any kind. We do not guarantee the accuracy, completeness, or reliability of the reports and datasets. We are not liable for any damages resulting from the use or inability to use the website or its content.
Contact Information:
If you have any questions about these terms and conditions, please contact us at chairmanoffice@indiancst.in.